S&P 500 Monthly Returns and Percentage of Time Up – Presidential Cycle Year 4

S&P 500 Monthly Returns and Percentage of Time Up – Presidential Cycle Year 4 Seasonality serves as a valuable tool for assessing probabilities in the stock market. According to historical data, U.S. stocks often demonstrate notable strength during the summer months of election years. Image: BofA Global Research

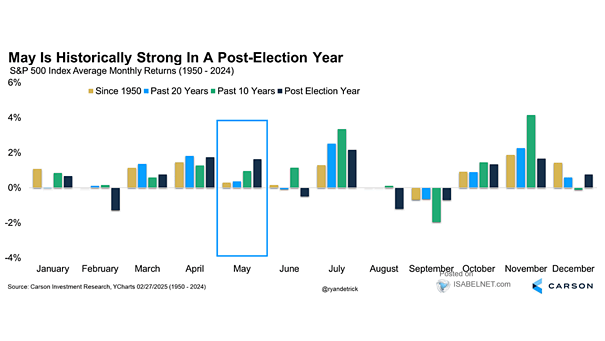
Seasonality – S&P 500 Index Average Monthly Returns

Seasonality – S&P 500 Index Average Monthly Returns Seasonality has been a tailwind for U.S. stocks in July, which has averaged a 2.3% gain over the past 20 years. This makes July a month of potential profitability and market momentum. Image: Carson Investment Research

S&P 500 Monthly Returns During an U.S. Election Year

S&P 500 Monthly Returns During an U.S. Election Year Historical data shows that the S&P 500 tends to perform strongly during the months of June, July, and August in election years, supporting the expectation of a summer rally. Image: Carson Investment Research

Seasonality – S&P 500 Monthly Returns

Seasonality – S&P 500 Monthly Returns Seasonality serves as a valuable tool for assessing probabilities in the stock market. Historically, the month of April has been favorable for U.S. stocks. Image: Goldman Sachs Global Investment Research

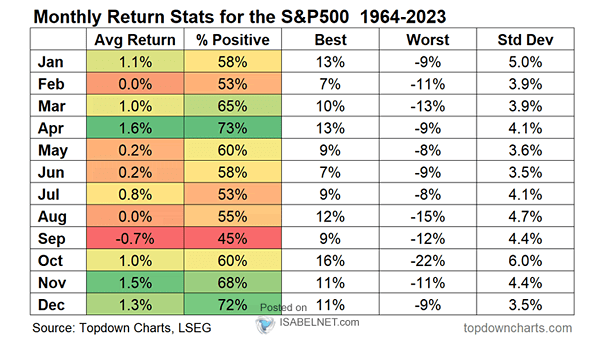
Seasonality – Monthly Return Stats for the S&P 500

Seasonality – Monthly Return Stats for the S&P 500 Seasonality can be a valuable tool when it comes to evaluating probabilities. Historically, November and December have tended to be positive months for the S&P 500 in pre-election years. Image: Topdown Charts

Seasonality – Nasdaq Monthly Returns

Seasonality – Nasdaq Monthly Returns Seasonality is very useful for assessing probabilities, not certainties. This is one factor that can impact the Nasdaq price. Image: Goldman Sachs Global Investment Research