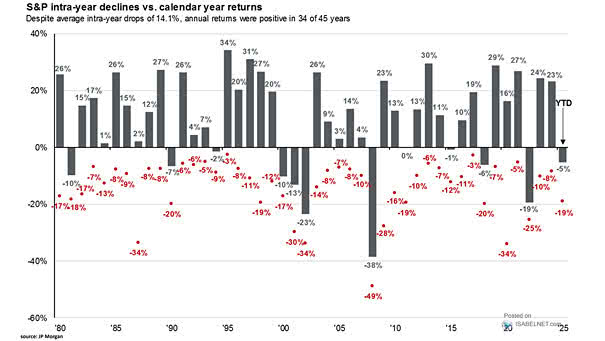
S&P 500 Intra-Year Declines vs. Calendar Year Returns
S&P 500 Intra-Year Declines vs. Calendar Year Returns Even with average intra-year drops of 14.1%, the S&P 500 achieved positive annual returns in 34 out of the past 45 years, highlighting the importance of staying invested through market volatility. Image: J.P. Morgan Asset Management