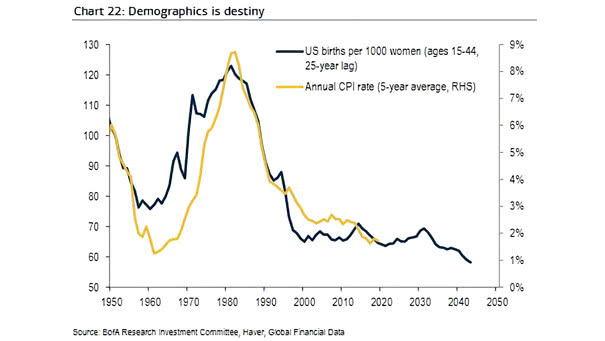
U.S. Demographics vs. U.S. Inflation
U.S. Demographics vs. U.S. Inflation Chart suggesting the correlation between demographics and inflation in the United States. Image: BofA Research Investment Committee
U.S. Demographics vs. U.S. Inflation Chart suggesting the correlation between demographics and inflation in the United States. Image: BofA Research Investment Committee
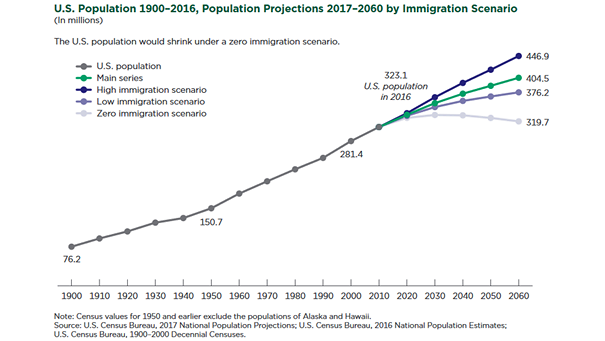
Demographics – U.S. Population Projections Under Alternative Immigration Scenarios In a high immigration scenario, the U.S. population is projected to grow to 446.9 million in 2060. Image: U.S. Census Bureau

Demographics – World Population since 1400 The United Nations predict that the world’s population will increase from 7.7 billion currently to 9.7 billion in 2050. Image: Deutsche Bank
Demographics – Share of Population Aged 65 and Over While global population is aging, the population in Europe is aging rapidly. Image: Financial Times
Debt, Demographics and Labor Force Growth The slowdown in the labor force in the U.S., China, Europe and Japan, represents 62% of the world’s GDP and 69% of the equity market capitalization. The labor force growth is expected to be -1% by 2055. Image: Fidelity Investments
U.S. Demographics – Portfolio Allocation to Equities Chart suggesting that the average U.S. investor will move from holding 59% in equities to 56% by 2031, due to aging. Image: Arbor Research & Trading LLC
Demographics – U.S. Population Growth The U.S. population continues to grow today, but it is growing at the slowest rate since 1937. This means an aging, slow-growing future for the U.S..
Demographics – U.S. Money Velocity and Population Growth The population of 20-54s will start to increase and could therefore lead to higher money velocity. Image: Longview Economics
Demographics – U.S. Inflation (CPI) vs. U.S. Population Aged 20-54 The population of 20-54s will start to increase and could therefore lead to a return to inflation. Image: Longview Economics
Demographics – Labor Force Growth and Term Premium Chart suggesting that growth in the labor force could explain the term premium. The term premium is the risk premium (or the bonus) that investors receive for the risk of owning longer-term bonds. Image: Fidelity Investments
Demographics – U.S. 10-Year Rate, Labor Force Growth and Nominal GDP Growth Chart suggesting that the current trend in labor force growth and nominal GDP growth points to higher rates. Image: Swedbank Research