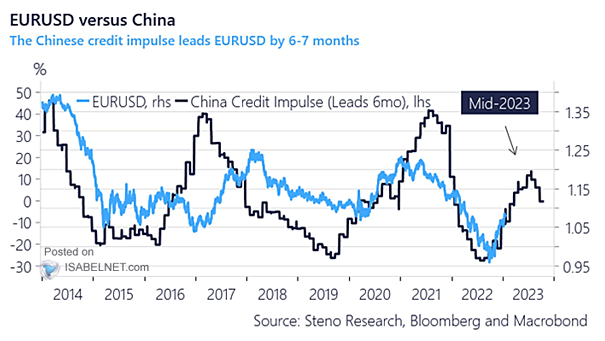
China Credit Impulse and Euro to U.S. Dollar (EUR/USD) – Leading Indicator
China Credit Impulse and Euro to U.S. Dollar (EUR/USD) – Leading Indicator Will EUR/USD peak in mid-2023? Image: Steno Research
China Credit Impulse and Euro to U.S. Dollar (EUR/USD) – Leading Indicator Will EUR/USD peak in mid-2023? Image: Steno Research
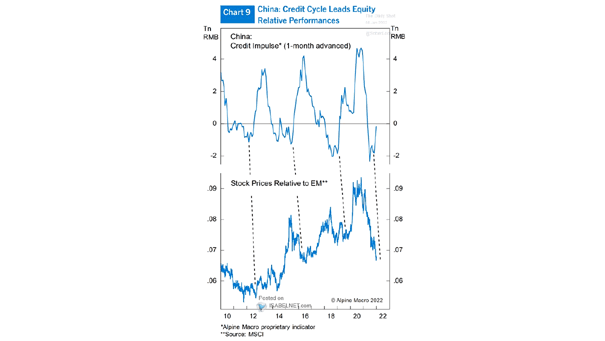
Stocks – China Credit Impulse and China Stock Prices Relative to EM (Leading Indicator) China credit impulse tends to lead Chinese stock prices relative to EM by one month. Image: Alpine Macro

China Credit Impulse Investors should be pleased as Chinese credit stimulus is on the way. Image: Alpine Macro
China Credit Impulse and Global Exports, China M1 and Industrial Commodity Prices (Leading Indicators) China credit impulse tends to lead global exports by 12 months. Image: Alpine Macro
Commodities vs. China Credit Impulse Commodities look expensive vs. China credit impulse. Image: Morgan Stanley Wealth Management
China Credit Impulse and Commodities (Leading Indicator) China credit impulse tends to lead commodity prices by 12 months. Image: Nordea and Macrobond
China Credit Impulse and U.S. Generic Government 10-Year Yield (Leading Indicator) China’s credit impulse tends to lead the U.S. 10-year bond yield by 12 months. Is it time to buy long-dated bonds? Image: Nordea and Macrobond
Euro to U.S. Dollar (EUR/USD) and China Credit Impulse – Leading Indicator China credit impulse tends to lead EUR/USD by 14 months. Image: Nordea and Macrobond
China Credit Impulse Leads Global Manufacturing PMI China credit impulse tends to lead global manufacturing PMI by 12 months. Credit impulse is the change in new credit issued as a percentage of GDP. Image: Nordea and Macrobond
China Credit Impulse and U.S. 10-Year Treasury Yield (Leading Indicator) China’s credit impulse tends to lead the U.S. 10-year Treasury yield by one year. Lower Treasury yields ahead? Image: Alpine Macro
China Credit and Fiscal Impulse and Commodities (Leading Indicator) China credit and fiscal impulse tends to lead commodity prices by 9 months. Image: BCA Research