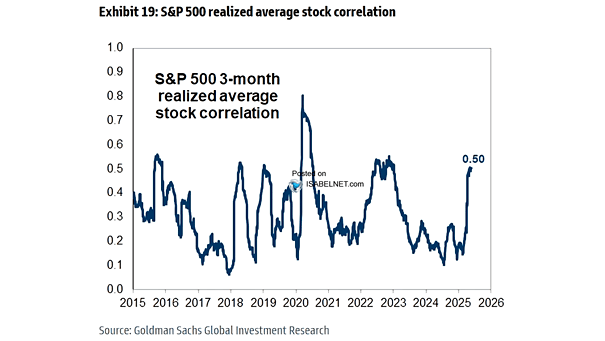
Rolling 24 Month Correlation Between U.S. Bonds and Equities

Rolling 24 Month Correlation Between U.S. Treasury Bonds and Equities Amid high inflation, UST bonds become less effective as a hedge against U.S. stocks, as rising prices erode bond payouts and interest rate hikes lead to a drop in bond prices. Image: BofA Research Investment Committee

S&P 500 Realized 3-Month Single Stock Correlation

S&P 500 Realized 3-Month Single Stock Correlation The current low correlation regime is reminiscent of the dot-com bubble and could persist for some time, but history suggests it will likely reverse when the market experiences its next downturn. Image: BofA Global Research

Correlation Between the S&P 500 and U.S. 10-Year Treasury Yields

Correlation Between the S&P 500 and U.S. 10-Year Treasury Yields The negative correlation between the S&P 500 and U.S. Treasury yields has weakened significantly since August. This moderation in the negative correlation may be seen as good news. Image: BofA Global Research

S&P 500 – Cross-Asset Correlations

S&P 500 – Cross-Asset Correlations So far, the S&P 500 remains inversely correlated with the U.S. dollar and positively correlated with U.S. 10-year bonds. Image: Goldman Sachs Global Investment Research