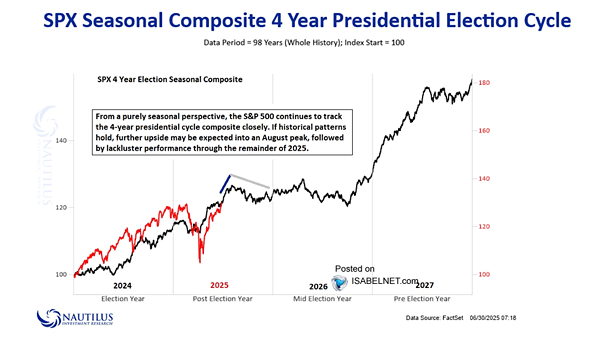
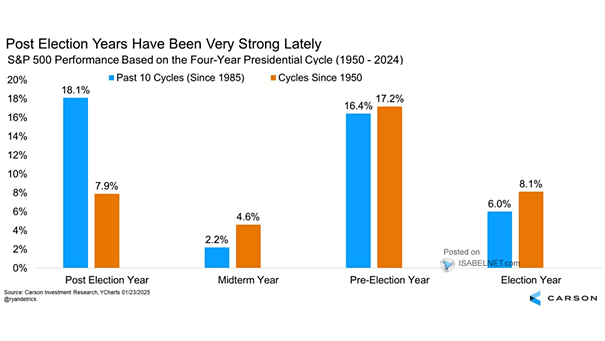
S&P 500 Performance per Year of a 4-Year Presidential Cycle

S&P 500 Performance per Year of a 4-Year Presidential Cycle U.S. stock markets generally perform better in the initial two years when a President is re-elected versus when a new President takes office. Image: Carson Investment Research

U.S. 10-Year Treasury Yield Around Close Presidential Elections

U.S. 10-Year Treasury Yield Around Close Presidential Elections While U.S. elections are significant in shaping economic policy and affecting investor sentiment, they do not consistently drive changes in the U.S. 10-year Treasury yield. Image: Deutsche Bank Asset Allocation

S&P 500 Around Close Presidential Elections

S&P 500 Around Close Presidential Elections The cyclical behavior of equity markets around U.S. elections reflects a pattern where pre-election pullbacks are common, followed by post-election rallies as policy uncertainties dissipate. Image: Deutsche Bank Asset Allocation

U.S. Stock Returns Over the Past Presidential Terms Starting on Election Day

U.S. Stock Returns Over the Past Presidential Terms Starting on Election Day During President Biden’s tenure, U.S. stocks have surged by 76% starting on election day, reinforcing historical data suggesting that Democratic administrations often correlate with stronger market performance compared to their Republican counterparts. Image: Carson Investment Research

S&P 500 Performance by President

S&P 500 Performance by President While the S&P 500 has generally trended upward under both Democratic and Republican administrations, average gains have historically been higher during Democratic presidencies. Image: J.P. Morgan Equity Macro Research

30-Year U.S. Treasury Yields Around Presidential Election Dates

30-Year U.S. Treasury Yields Around Presidential Election Dates Historically, 30-year U.S. Treasury yields have tended to rise after Republican victories and fall after Democratic victories, reflecting market perceptions of each party’s economic policies. Image: Deutsche Bank

U.S. Presidential Election

U.S. Presidential Election Recent prediction market data indicates that the gap between Donald Trump and Vice President Kamala Harris in the 2024 U.S. presidential race is narrowing. Image: Bloomberg

S&P 500 Around Predictable U.S. Presidential Elections

S&P 500 Around Predictable U.S. Presidential Elections While U.S. elections can create anxiety and volatility due to policy uncertainties, predictable elections often coincide with continued market trends and reduced market volatility. Image: Deutsche Bank Asset Allocation

S&P 500 Around Close Presidential U.S. Elections

S&P 500 Around Close Presidential U.S. Elections Election Day frequently serves as a catalyst for the S&P 500, with the index typically surging as political uncertainties give way to clarity. Image: Deutsche Bank

S&P 500 and Odds of Winning U.S. Presidential Election

S&P 500 and Odds of Winning U.S. Presidential Election The rising odds for Trump in prediction markets have been closely tied to an upswing in S&P 500 prices, reflecting investor sentiment that aligns with potential changes in economic policy should he win the election. Image: Morgan Stanley Research