S&P 500 Index Declines Around Recessions

S&P 500 Index Declines Around Recessions Historically, the S&P 500 has fallen by a median 24% from peak-to-trough around economic recessions. Image: Goldman Sachs Global Investment Research

Estimated U.S. Recession Probability

Estimated U.S. Recession Probability Goldman Sachs has increased its forecast for a U.S. recession in the next 12 months to 35%, up from 20%, attributing the change to rising trade tensions and weakening consumer and business confidence. Image: Goldman Sachs Global Investment Research

Smoothed U.S. Recession Probabilities

Smoothed U.S. Recession Probabilities The probability of U.S. recession stands at 0.26%. When this recession indicator exceeds 5% (red line), history suggests that the probability of recession increases significantly. The chart shows the smoothed U.S. recession probabilities indicator on a log scale. Smoothed U.S. recession probabilities are obtained from a dynamic-factor markov-switching model applied to…

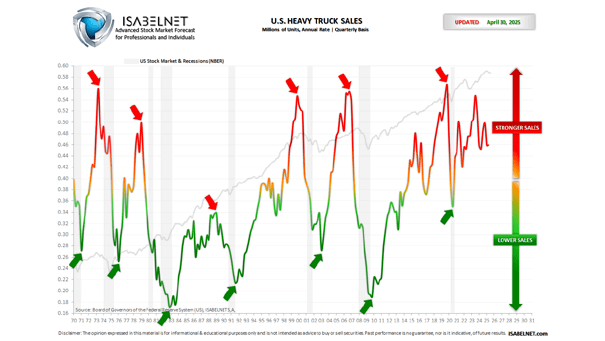
U.S. Heavy Truck Sales and Recessions

U.S. Heavy Truck Sales and Recessions U.S. heavy truck sales fell in February to 436K (annualized). Before recessions, heavy trucks sales tend to peak and then decline, providing insights into the overall health of the U.S. economy as a leading economic indicator. Click the Image to Enlarge
ISM Composite Index vs. Recessions

ISM Composite Index vs. Recessions While indicating slower growth, the economically weighted ISM composite index still points to expansionary conditions in the U.S. economy, without signaling an impending recession. Image: Real Investment Advice

S&P 500 Corrections and Recessions

S&P 500 Corrections and Recessions Deutsche Bank Research analysis shows that in 12% of S&P 500 corrections, a recession had already begun. Moreover, in 56% of cases, no recession occurred within a year before or after the correction started. Image: Deutsche Bank