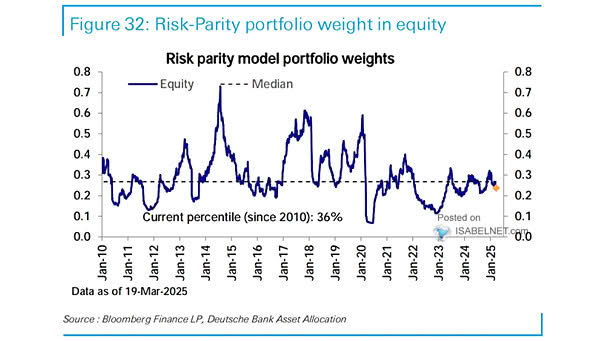
Risk Parity Model Portfolio Weights
Risk Parity Model Portfolio Weights In risk-parity strategies, the current equity allocation is at the 8th percentile—well below the median—reflecting a preference for safer assets despite the ongoing equity rally. Image: Deutsche Bank Asset Allocation