U.S. Earnings to Price – Top vs. Bottom Decile (10-Year Annual Compounded Return)
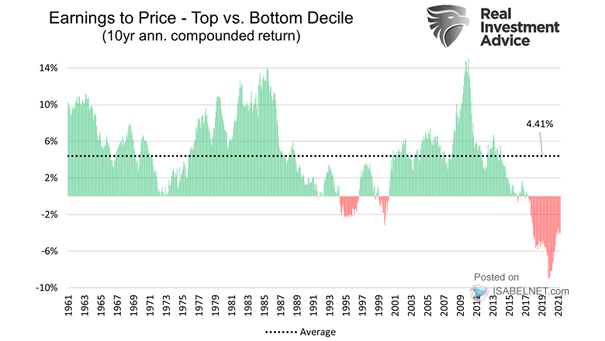
U.S. Earnings to Price – Top vs. Bottom Decile (10-Year Annual Compounded Return) When will value stocks outperform growth stocks again? Image: Real Investment Advice
U.S. Earnings to Price – Top vs. Bottom Decile (10-Year Annual Compounded Return) When will value stocks outperform growth stocks again? Image: Real Investment Advice
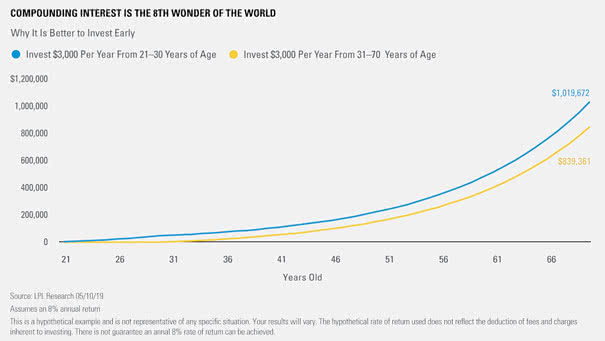
Why Albert Einstein Said “Compound Interest Is the Eighth Wonder of the World” If you invest $3000 per year from 10 years before you turn 30, you would earn more money when you turn 70 than if you invest $3000 per year from 30 until 70. That’s the power of compounding, because the amount earned…

The Long-Term Impact of Compounded Returns The amount earned from compounding grows exponentially over time. Successful investing is all about patience and discipline. So, a lack of patience and investment discipline may impact long-term returns. And keep in mind that the power compounding only works if you do not lose capital during the investment horizon. What about compound…
S&P 500 Realized 10-Year Dividend Annualized Growth Rate Goldman Sachs expects a 10-year compound annual growth rate of 6.2% for S&P 500 dividends. Image: Goldman Sachs Global Investment Research
S&P 500 Dividends per Share Goldman Sachs expects a 10-year compound annual growth rate of 7% for S&P 500 dividends. Image: Goldman Sachs Global Investment Research
Valuation – Emerging Market and Developed Market Countries – PE10 vs. 10-Year Forward Returns Valuation matters over time in the stock market. This chart shows the PE10 vs. subsequent 10-year CAGR (Compound Annual Growth Rate). Image: Topdown Charts
S&P 500 Total Return: % Positive Chart suggesting that increasing the holding period increases the likelihood of success. Image: Compound Capital Advisors, LLC
60/40 Portfolio Nominal Returns by Decade This decade, the 60/40 portfolio compounded at 9.5% a year. Image: Ritholtz Wealth Management LLC
Starting Valuation Predicts Future Returns Based on the Shiller CAPE ratio, the chart suggests a 10-year compound annual growth rate of only 2% to 4% for the U.S. stock market. Image: Fidelity Investments
How to Double your Money in the Market In this video, Josh Brown, financial advisor at Ritholtz Wealth Management LLC, explains why the power of compounding can help you double your money. You may also like “The Long-Term Impact of Compounded Returns” and why Albert Einstein said “Compound Interest Is the Eighth Wonder of the World.”…
Stock Market Forecasting Models vs. US Stock Market – Growth of $1,000 As an example, the chart shows the growth of $1,000 since 1970, between the stock market forecasting models and the US stock market (compound return before taxes, fees and transactions costs – unleveraged, simulated long & short trades – quarterly basis & logarithmic…