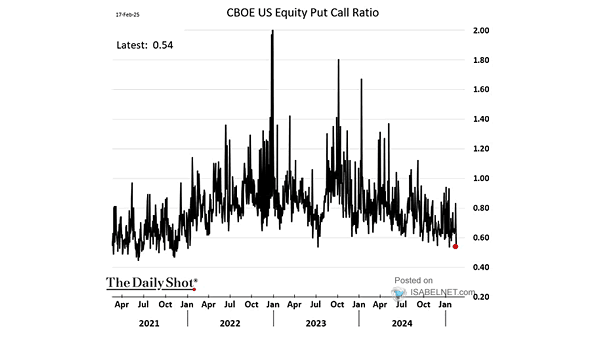
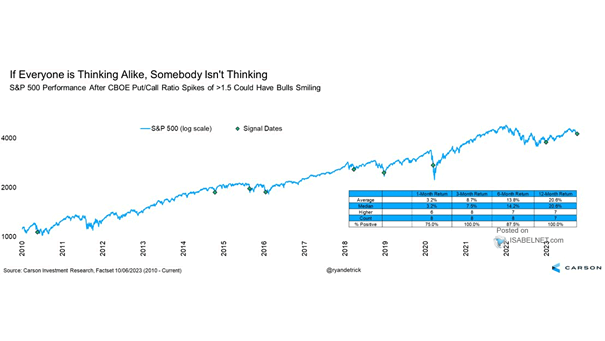
CBOE Equity Put/Call Ratio
CBOE Equity Put/Call Ratio The equity put/call ratio suggests very bearish sentiment. Image: The Daily Shot
CBOE U.S. Put/Call Ratio Composite The U.S. put/call ratio is trading at relatively high levels, which is contrarian bullish. Image: The Daily Shot
Central Banks – Quarterly Pace of Fed, ECB, BoJ, BOE Net Purchases (Quantitative Easing – QE) The pace of global central bank purchases is expected to turn negative in Q1 2022. Image: BofA Global Research
Nasdaq 100/Russell 2000 vs. Nasdaq 100/S&P 500 and CBOE Equity Put/Call Ratio Is Tech in a bubble? Image: Nordea and Macrobond
CBOE Put/Call Ratio and S&P 500 Index The put/call ratio suggests that investors are complacent. Image: Bloomberg
Central Banks and U.S. Financial Conditions Index (FCI) If the Fed, the ECB and the BoE wait until 2025 before raising rates, financial conditions should remain very easy. Image: Goldman Sachs Global Investment Research
G4 Central Bank Balance Sheet The combined G4 central bank balance sheet (Fed, ECB, BoJ, BoE) should continue to expand further. Image: J.P. Morgan
G4 Central Bank Balance Sheet, Flow The combined G4 central bank balance sheet (Fed, ECB, BoJ, BoE) is expected to expand further. Image: J.P. Morgan
G4 Central Bank Balance Sheet as % of GDP and MSCI World Index G4 central bank balance sheet (Fed, ECB, BoJ, BoE) as % of GDP is expanding. Image: Jeroen Blokland
The Yield Curve Leads VIX (Volatility) by Three Years Is more volatility expected ahead? This chart suggests that the CBOE Volatility Index or VIX usually follows the U.S. 10-year vs. 2-year Treasury spread (inverted) with a 3-year lag. Image: Morgan Stanley Research