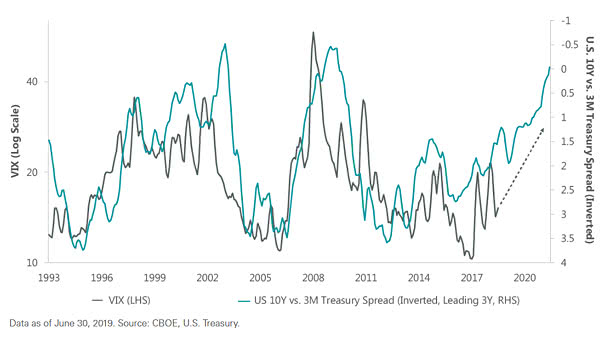
The Yield Curve Leads VIX (Volatility) by Three Years
The Yield Curve Leads VIX (Volatility) by Three Years Is more volatility expected ahead? This chart suggests that the CBOE Volatility Index or VIX usually follows the U.S. 10-year vs. 3-month Treasury spread (inverted) with a 3-year lag. You may also like “VIX is in a Transitory State” and “Fed Funds Target Rate and VIX.”…