Monetary Policy Conditions Index vs. S&P 500
Monetary Policy Conditions Index vs. S&P 500 Will the monetary policy conditions index continue to ease pressure on the S&P 500? Image: Real Investment Advice
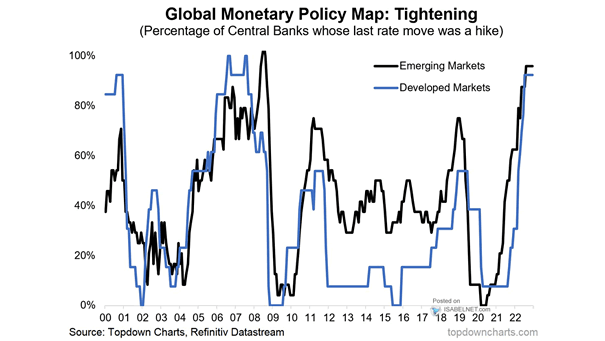
Global Monetary Policy Map So far, global central banks remain firmly in a tightening mode. Image: Topdown Charts
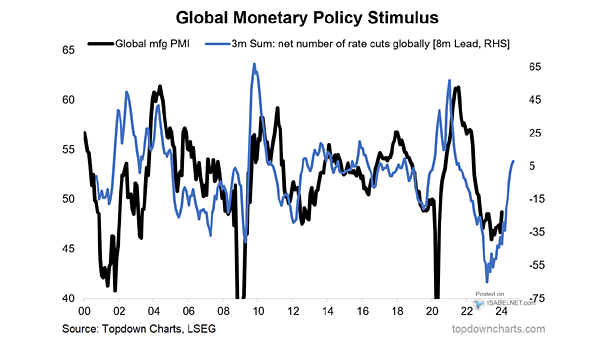
Central Banks – Global Monetary Policy Stimulus Leads Global Manufacturing PMI Global monetary policy stimulus tends to lead global manufacturing PMI by 8 months. Is a hard landing inevitable? Image: Topdown Charts
Global Monetary Policy Rates Will inflation cause central banks to tighten monetary policy quicker than expected? Image: Topdown Charts
Monetary Policy – China vs. U.S. Homebuilders China and the United States are expected to diverge on monetary policy this year. Image: BofA Global Investment Strategy
Fiscal and Monetary Policy – S&P 500 Real Total Return vs. the Fed Balance Sheet This chart shows the S&P 500 Real Total Return vs. the Fed balance sheet since 1937. Image: Fidelity Investments
U.S. Monetary Policy, Term Premium and Yield Curve This chart suggests when U.S. monetary policy is too tight or too loose. An inverted yield curve is a sign that monetary policy is too tight. Image: Fidelity Investments
Emerging Markets Monetary Policy vs. Economic Cycle (Leading Indicator) Chart suggesting that EM monetary policy easing is likely to increase economic activity in the coming months. Image: Topdown Charts
China’s Monetary Policy The Chinese banks’ reserve requirement ratio will be cut by 50 bps on January 6, to 12.5%. Image: Bianco Research
Monetary Policy and Fed Funds Rate According to market rates, monetary policy is more neutral than accommodative. Image: Danske Research