Tech Stocks – U.S. 30-Year Yield and META
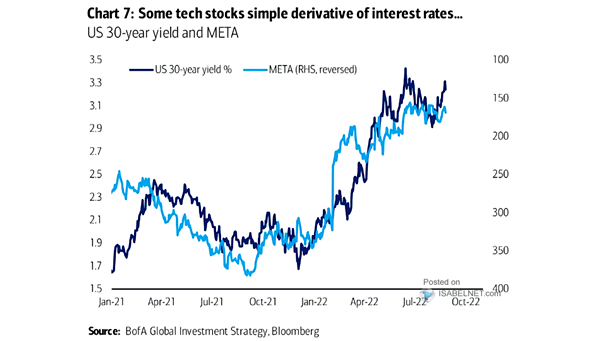
Tech Stocks – U.S. 30-Year Yield and META Some tech stocks tend to be a simple derivative of interest rates Image: BofA Global Investment Strategy
Tech Stocks – U.S. 30-Year Yield and META Some tech stocks tend to be a simple derivative of interest rates Image: BofA Global Investment Strategy
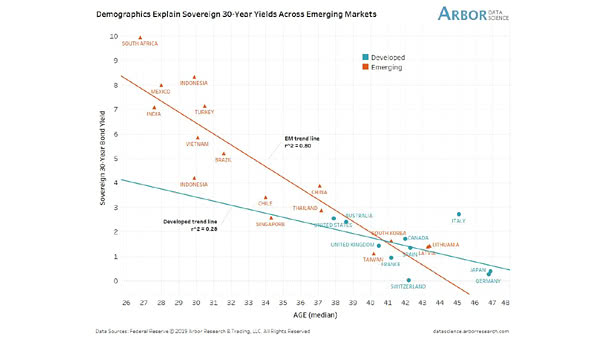
Demographics Explain Sovereign 30-Year Yields Accross Emerging Markets Another great chart showing that emerging market demographics explain 30-year sovereign bond yields. An R² of 0.80 is quite high and significant. You may also like “U.S. Population Growth vs. U.S. 10-Year Treasury Bond Yield.” Image: Arbor Research & Trading LLC

30-Year U.S. Treasury Yields Around Presidential Election Dates Historically, 30-year U.S. Treasury yields have tended to rise after Republican victories and fall after Democratic victories, reflecting market perceptions of each party’s economic policies. Image: Deutsche Bank
U.S. 30-Year Government Bond Yield How high will 30-year U.S. Treasury yields rise? Image: The Daily Shot
Yield Curve – U.S. 30-Year – 2-Year Government Bond Spread The 30Y-2Y inverted yield curve does not bode well for the U.S. economy. Image: The Daily Shot
Performance – COVID-19 Reopening vs. Lockdown Portfolio and U.S. 30-Year Treasury Yield BofA expects 30-year U.S. Treasury yields to rise and the “reopening portfolio” to fall. Image: BofA Global Investment Strategy
S&P 500 Value Index/S&P 500 Growth Index vs. 30-Year Treasury Yield The direction of long-term interest rates tends to drive the style rotation. Image: Morgan Stanley Wealth Management
Bonds and Correlations – 30-Year Treasury Yield The U.S. 30-year Treasury yield correlates with many intra-equity trends. Image: Alpine Macro
U.S. 30-Year Government Bond Yield and Russell 2000 Relative to S&P 500 As the chart suggests, U.S. 30-year yields are likely to increase further. Image: BCA Research
U.S. 30-Year Treasury Yield and Asset Allocation In a low yield environment, does a 40% bond allocation still make sense? Image: BofA Global Investment Strategy
U.S. 30-Year Mortgage Rates vs. 10-Year U.S. Treasury Yield U.S. 30-year mortgage rates have fallen to record low, but remain elevated relative to the 10-year U.S. Treasury yield. Image: Goldman Sachs Global Investment Research