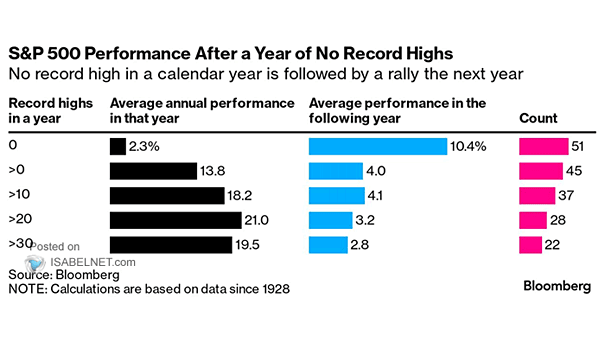
S&P 500 Performance After a Year of No Record Highs
S&P 500 Performance After a Year of No Record Highs From a historical perspective, the absence of a record high in the S&P 500 Index since the start of the year could indicate the possibility of a substantial rally taking place in 2024. Image: Bloomberg