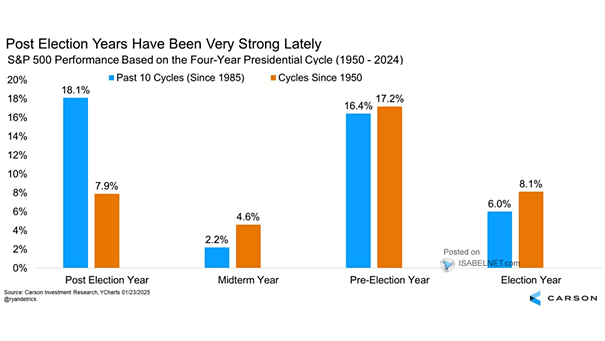
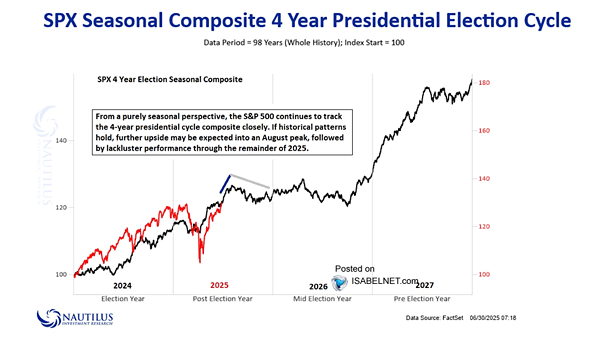
Stock Returns over the Past 33 Presidential Terms Starting on Inauguration Day

Stock Returns over the Past 33 Presidential Terms Starting on Inauguration Day U.S. stocks, after experiencing a historic drop at the start of the year, have made a strong recovery during Trump’s second term and are now in positive territory for 2025, fueling renewed optimism among bulls. Image: Carson Investment Research

U.S. Presidential Approval Rating vs. Consumer Confidence

U.S. Presidential Approval Rating vs. Consumer Confidence Trump’s approval exceeds Biden’s late-term lows, but deteriorating consumer confidence’s predictive power signals substantial downside risk as economic anxieties translate into political consequences. Image: Deutsche Bank Asset Allocation

S&P 500 Index Quarterly Returns Based on the Four-Year Presidential Cycle

S&P 500 Index Quarterly Returns Based on the Four-Year Presidential Cycle U.S. stocks often experience weakness in Q1 of a post-election year, reflecting uncertainty tied to new policies and economic adjustments. However, the second quarter typically shows stronger performance, offering hope for recovery. Image: Carson Investment Research

S&P 500 Index Returns Based on 4-Year Presidential Cycle

S&P 500 Index Returns Based on 4-Year Presidential Cycle Bulls have reason to be cheerful as post-election years tend to bring solid market gains. Since 1985, the S&P 500 has risen by an average of over 18% during these years, with positive results in nine out of ten cases. Image: Carson Investment Research

S&P 500 Around Close Presidential Elections

S&P 500 Around Close Presidential Elections The cyclical nature of equity markets around U.S. elections often leads to rallies after the election as policy uncertainties fade. Image: Deutsche Bank Asset Allocation

S&P 500 Performance per Year of a 4-Year Presidential Cycle

S&P 500 Performance per Year of a 4-Year Presidential Cycle The U.S. stock market typically outperforms in the first two years of a President’s second term compared to a new President’s term, suggesting a potentially strong year for stocks and giving bulls reason to smile. Image: Carson Investment Research

U.S. 10-Year Treasury Yield Around Close Presidential Elections

U.S. 10-Year Treasury Yield Around Close Presidential Elections While U.S. elections are significant in shaping economic policy and affecting investor sentiment, they do not consistently drive changes in the U.S. 10-year Treasury yield. Image: Deutsche Bank Asset Allocation

U.S. Stock Returns Over the Past Presidential Terms Starting on Election Day

U.S. Stock Returns Over the Past Presidential Terms Starting on Election Day During President Biden’s tenure, U.S. stocks have surged by 76% starting on election day, reinforcing historical data suggesting that Democratic administrations often correlate with stronger market performance compared to their Republican counterparts. Image: Carson Investment Research

30-Year U.S. Treasury Yields Around Presidential Election Dates

30-Year U.S. Treasury Yields Around Presidential Election Dates Historically, 30-year U.S. Treasury yields have tended to rise after Republican victories and fall after Democratic victories, reflecting market perceptions of each party’s economic policies. Image: Deutsche Bank

U.S. Presidential Election

U.S. Presidential Election Recent prediction market data indicates that the gap between Donald Trump and Vice President Kamala Harris in the 2024 U.S. presidential race is narrowing. Image: Bloomberg