U.S. Presidential Election
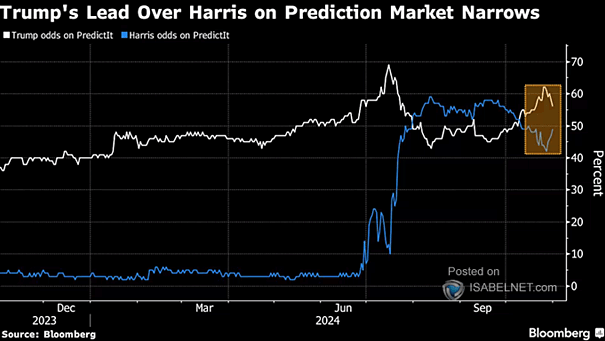
U.S. Presidential Election Recent prediction market data indicates that the gap between Donald Trump and Vice President Kamala Harris in the 2024 U.S. presidential race is narrowing. Image: Bloomberg
U.S. Presidential Election Recent prediction market data indicates that the gap between Donald Trump and Vice President Kamala Harris in the 2024 U.S. presidential race is narrowing. Image: Bloomberg
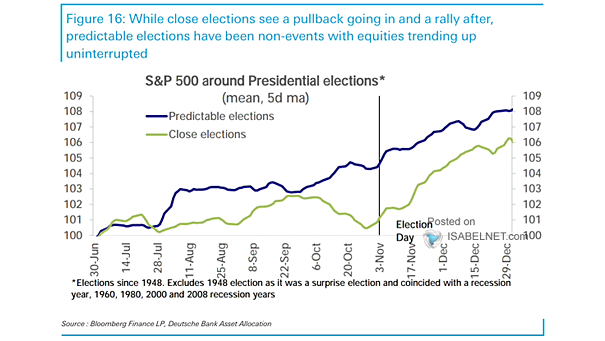
S&P 500 Around Predictable U.S. Presidential Elections While U.S. elections can create anxiety and volatility due to policy uncertainties, predictable elections often coincide with continued market trends and reduced market volatility. Image: Deutsche Bank Asset Allocation

S&P 500 Around Close Presidential U.S. Elections Election Day frequently serves as a catalyst for the S&P 500, with the index typically surging as political uncertainties give way to clarity. Image: Deutsche Bank
S&P 500 and Odds of Winning U.S. Presidential Election The rising odds for Trump in prediction markets have been closely tied to an upswing in S&P 500 prices, reflecting investor sentiment that aligns with potential changes in economic policy should he win the election. Image: Morgan Stanley Research
S&P 500 Monthly Returns and Percentage of Time Up – Presidential Cycle Year 4 Seasonality provides valuable insights into stock market trends. Historically, after experiencing weaknesses in September and October during election years, the S&P 500 tends to rebound with strong returns in November and December. Image: BofA Global Research
Cumulative U.S. Equity Fund Flows from 1 Year Before to 1 Year After U.S. Presidential Elections Since 2004 Positive flows into U.S. equity funds could help support further gains in the S&P 500 after the upcoming U.S. presidential election. Image: Goldman Sachs Global Investment Research
Implied Probabilities for the U.S. Presidential Election The prediction markets are suggesting a high probability of a Republican sweep in the upcoming 2024 U.S. elections, with potentially far-reaching implications for the political landscape. Image: Goldman Sachs Global Investment Research
S&P 500 3-Month Seasonal Returns and Presidential Cycle Year 4 June to August historically shines during election years, as it represents the strongest 3-month period in the fourth year of the presidential cycle, up 75% of the time with an average return of 7.27% since 1928. Image: BofA Global Research
S&P 500 Performance (May – October) Broken Down by Presidential Cycle Sell in May and go away? Since 1950, the S&P 500 has shown an average return of 2.3% during the period from May through October in election years, making it an attractive period for investors. Image: Carson Investment Research
S&P 500 Returns – The 4-Year Presidential Cycle The current presidential cycle for the S&P 500 is extended when compared to both the average and first term cycles, highlighting the market’s unique dynamics and complexity. Image: BofA Global Research
S&P 500 Presidential Cycle Considering the substantial cyclical correction in 2022, the current presidential cycle suggests that there is potential for the S&P 500 to perform well in 2024. Image: BofA Global Research