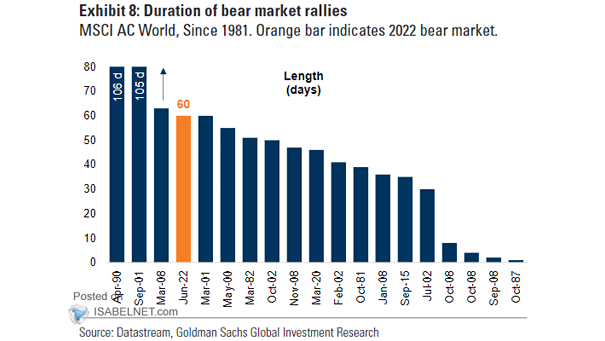
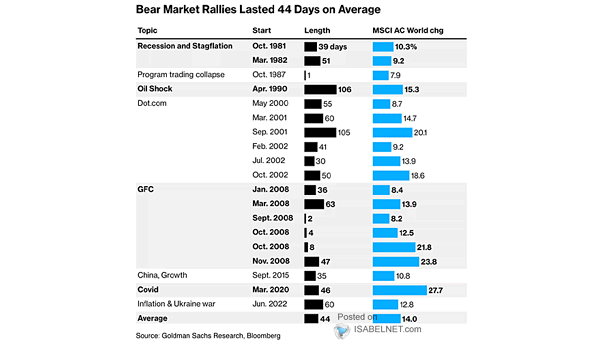
MSCI AC World – Bear Market Rallies
MSCI AC World – Bear Market Rallies Since the 1980s, there have been 19 global bear market rallies, lasting 44 days on average with MSCI AC World returns of 10–15%. Image: Goldman Sachs Global Investment Research
U.S. Bear Markets Rallies Bear markets rallies tend to be sharp and short-lived. Image: MarketDesk Research
S&P 500 Rally in Comparison with Rallies in 1929, 1938, 1974 and 2009 The current rally is the greatest of all time U.S. stock market rally. Image: BofA Global Investment Strategy
S&P 500 Index Returns After the Best 6 Month Rallies Ever (>30%) After the best 6 month rallies ever (>30%), it tends to be bullish for stocks over the next 12 months. Image: LPL Research
Current Rally of S&P 500 vs. Greatest Bear Market Rallies of All-Time This chart puts into perspective the current rally of S&P 500 vs. greatest bear market rallies of all-time. The potential trajectory could suggest the S&P 500 at 3300-3600. Image: BofA
Bear Market Rallies Goldman Sachs is still cautious about the idea that stocks have bottomed, as bear market rallies are typical before index troughs. Image: Goldman Sachs Global Investment Research
Bear Market “Head Fake” Rallies Since 1937, eleven bear markets experienced a “head fake” rally, when the real economic pain began in the United States. Image: CNBC
S&P 500 Rallies – Distribution of Duration Between 3%+ Sell-Offs Rallies lasting more than 100 days are rare. Image: Deutsche Bank Asset Allocation
MSCI ACWI Total Return Index – Rallies and Corrections Interesting chart showing the deviation of the MSCI AC World Total Return Index against its trend line, like the swing of a pendulum. Image: Fidelity Investments
Rallies in World Cyclicals vs. Defensives Since the global financial crisis, average rallies in world cyclicals vs. defensives have lasted only four months. Image: Goldman Sachs Global Investment Research
Historical Gold Bull Market Rallies Is it the start of a new gold bull market? This chart shows gold bull markets rallies compared to the most recent. Image: VanEck