Euro Area GDP vs. Current Activity Indicator
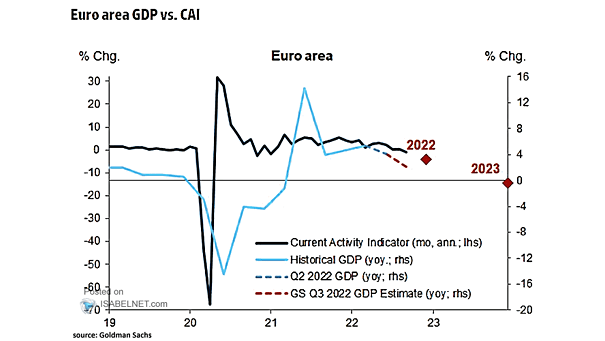
Euro Area GDP vs. Current Activity Indicator Will the eurozone face a severe economic slowdown in 2023? Image: Goldman Sachs Global Investment Research
Euro Area GDP vs. Current Activity Indicator Will the eurozone face a severe economic slowdown in 2023? Image: Goldman Sachs Global Investment Research
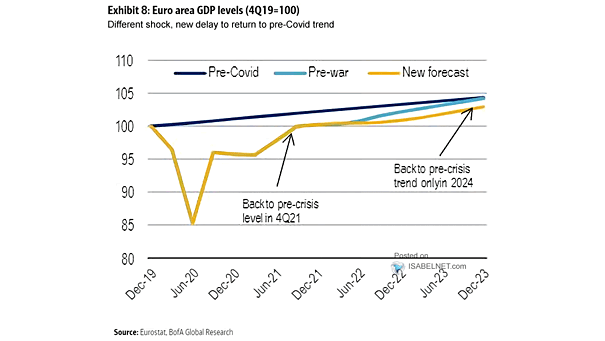
Euro Area GDP Forecasts When will euro area GDP reach the pre-crisis trend? Image: BofA Global Research

European Stocks – Euro Area M1 Momentum vs. Euro Area PMI Momentum Should investors be bearish on European stocks? Image: BofA Global Research
Fiscal Impulses in the Euro Area The fiscal impulse in the euro area is expected to remain expansionary. Image: Goldman Sachs Global Investment Research
Euro Area and U.S. Inflation and Central Bank Forecasts The Fed projects U.S. inflation well above 2% into 2023. Image: BlackRock Investment Institute
Ownership of Euro Area Equities The U.S. has become the dominant investor, owning 28% of euro area equities. Image: Goldman Sachs Global Investment Research
2020 Retail Sales in the U.S. and Euro Area This chart shows a sweet V-shaped recovery in U.S. and EU retail sales. Image: BofA Global Research
Quarterly GDP Trajectory, Base Case – U.S., Euro Area and China This chart suggests the base case scenario for 2020/2021 GDP growth. Image: BofA Global Research
Euro Area PMIs Euro area PMIs look V-shaped, so far. Image: Goldman Sachs Global Investment Research
U.S. and Euro Area GDP Loss and Deficit to GDP The peak-to-trough decline in U.S. and EA GDP is expected to be more than twice as large as during the global financial crisis. Image: Deutsche Bank Research
Debt and Deficits in Euro Area and U.S. Debt and deficits in the euro area and in the United States are expected to increase significantly. Image: Deutsche Bank Research