Valuation – GS Top-Down vs. Consensus Bottom-Up Estimates
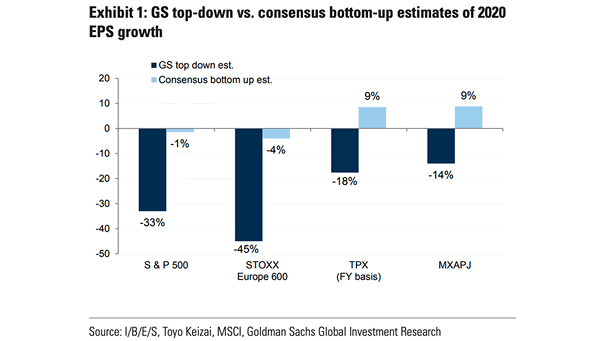
Valuation – GS Top-Down vs. Consensus Bottom-Up Estimates While a 14% consensus EPS growth forecast for the S&P 500 next year is plausible, some analysts view it as optimistic, awaiting confirmation from upcoming corporate earnings reports and macroeconomic developments. Image: Goldman Sachs Global Investment Research