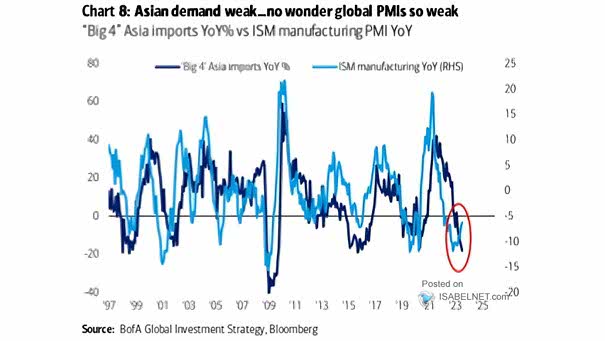
Big 4 Asia Imports vs. ISM Manufacturing PMI
Big 4 Asia Imports vs. ISM Manufacturing PMI The weak demand in Asian markets is affecting various industries and economies worldwide. Image: BofA Global Investment Strategy
Asia Dollar Index Could Asian currencies continue to weaken, as global recession fears mount? Image: BofA Global Investment Strategy
EM ex-Asia vs. EM Asia – Relative Price Performance Should investors continue to favor EM ex-Asia vs. Asia? Image: Topdown Charts
Asia Pacific EPS Growth Forecasts after the Fed Starts Tightening Equity markets in Asia tend to decline in the 12 months following the start of Fed tightening. Image: BofA Global Quantitative Strategy
Equities – MSCI Taiwan / MSCI Asia (Total Return in US$) If China attempts to invade Taiwan, what would it mean for stocks? Image: Gavekal, Macrobond
Equities – MSCI AC Asia Ex Japan Index (Price and EPS) and Asia Pacific Ex Japan (Inflation) Generally, stocks tend to perform well in a moderate inflationary environment. Image: Goldman Sachs Global Investment Research
Asia/U.S. High Yield Bond Spread Asian junk bonds look attractive relative to U.S. junk bonds. Image: Morgan Stanley Wealth Management
MSCI AC Asia Pacific Excluding Japan Index – MXAPJ Performance Before/After Bear Market Through Since 1970 The MSCI AC Asia Pacific Excluding Japan Index is up 66% from the March lows. The rally is much stronger than previous bounces since 1970.
Top 5 Stocks – MSCI Asia ex Japan Index vs. MSCI USA Index The MSCI Asia ex Japan Index is more concentrated in the 5 largest stocks than the MSCI USA Index. Image: Credit Suisse
Regional Share of Global GDP – North America, Europe and Japan vs. Asia ex-Japan Shifting patterns of global growth? This chart suggests that the center of gravity of global growth is shifting toward Asia. Image: BlackRock Investment Institute