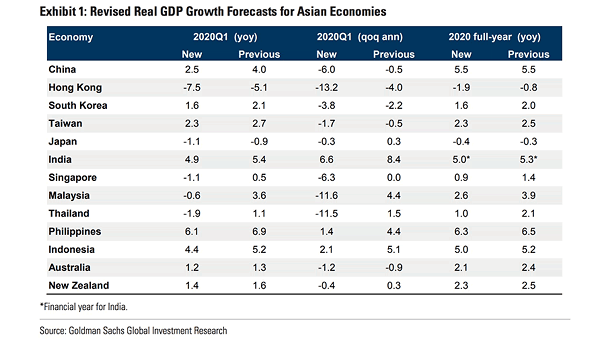
Revised Real GDP Growth Forecasts for Asian Economies
Revised Real GDP Growth Forecasts for Asian Economies Goldman Sachs slashed growth forecasts for Asian economies, as the coronavirus impacts economic activity. Image: Goldman Sachs Global Investment Research