This great tool shows the US stock market forecast for the next 12 months and the probability
This advanced mathematical model extracts insights from multiple financial data and suggests a stock market short-term forecast for the next 12 months with a very high degree of confidence.
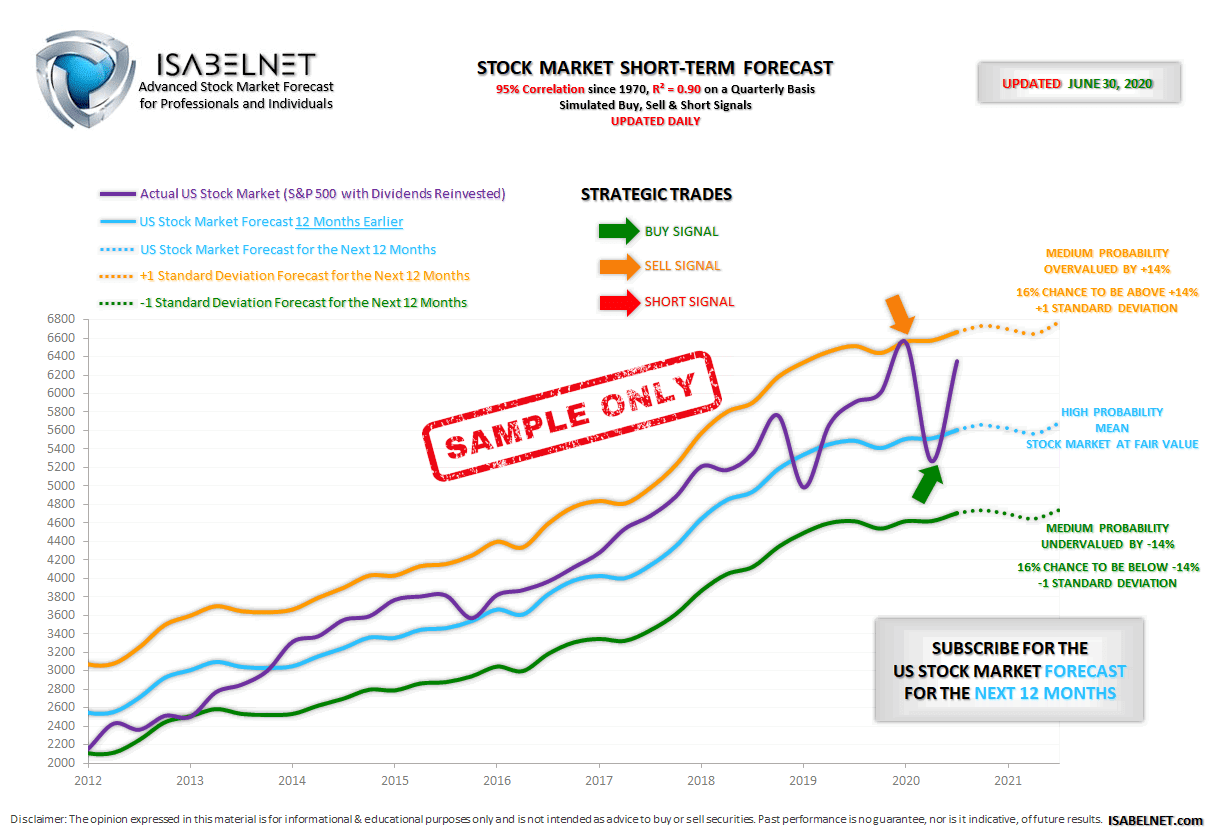
This great prediction model is updated daily, with strategic trades. It has a 95% correlation with the US stock market on a quarterly basis since 1970 and an R² of 0.90. It means that 90 percent of the US stock market variance is predictable by the flows of data used.
The purple line represents the S&P 500 with dividends reinvested as a proxy for the US stock market. The S&P 500 is the best-known proxy for the US stock market and captures 80% of the market capitalization. The blue line represents the US stock market forecast 12 months earlier. The orange and green lines represent the standard deviation of the US stock market forecast. And the dotted lines show the US stock market forecast for the next 12 months.
Knowing the direction of the forecast for the next 12 months, it is possible to anticipate the trend of the US stock market in the future.
Because the US stock market is often mispriced, it oscillates around the expected prediction. Each time the US stock market does not follow the direction of the forecast, it is a clear indication of an overvalued or undervalued stock market.
When the US stock market is above the forecast from 2014 to 2017, then it is overvalued.
And when the US stock market is below the forecast from 2010 to 2013, then it is undervalued.
Inevitably the US stock market will cross up or down the trend of the expected prediction, as a reversion to the mean. When the US stock market hits the forecast in 2010, 2011, 2012 and 2013, then the US stock market is at fair value. It is a high probability.
It is also easy to evaluate if the US stock market is cheap or expensive using the standard deviation of the forecast. When the US stock market hits the orange line, then it is overvalued by 14%. There is a 16% chance on a quarterly basis that the US stock market valuation will be above 14% or one standard deviation. It is a medium probability.
And when the US stock market hits the green line, then it is undervalued by -14%. There is a 16% chance on a quarterly basis that the US stock market valuation will be below -14% or one standard deviation. It is a medium probability.
This advanced forecasting model is a great decision support tool. As long as humans vacillate between fear and greed, the US stock market will be mispriced, and it’s not going to change. Occasionally the US stock market will be priced too low and sometimes it will be valued too high.
By using this formidable decision support tool, you will empower yourself to make much better investment decisions.