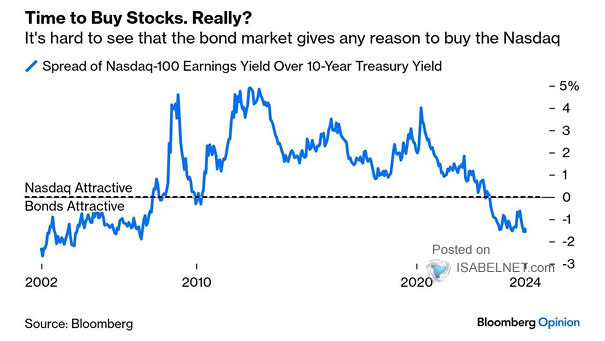
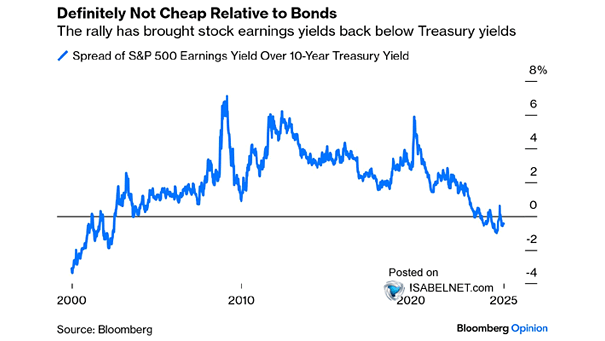
S&P 500 Earnings Yield Minus U.S. 10-Year Treasury Yield

S&P 500 Earnings Yield Minus U.S. 10-Year Treasury Yield The recent rally has made U.S. equities expensive compared to bonds. Historically, when the risk premium has been at current levels, the S&P 500 has delivered an average 12-month return of just 2.5% over the past three decades. Image: Bloomberg
S&P 500 Earnings Yield – UST 3-Month Yield

S&P 500 Earnings Yield – UST 3-Month Yield Historically, when the cash yield exceeds the earnings yield, this is often seen as a headwind for equities, as investors tend to prefer allocating their funds to cash investments rather than stocks. Image: BofA Global Investment Strategy

Mega-Cap Tech Earnings Yield Gap

Mega-Cap Tech Earnings Yield Gap How long will the mega-cap tech earnings yield gap vs. 10-year UST remain below the historical average? Image: Goldman Sachs Global Investment Research

S&P 500 Index Real Earnings Yield

S&P 500 Index Real Earnings Yield The real earnings yield on U.S. stocks has never been lower. Image: Morgan Stanley Wealth Management