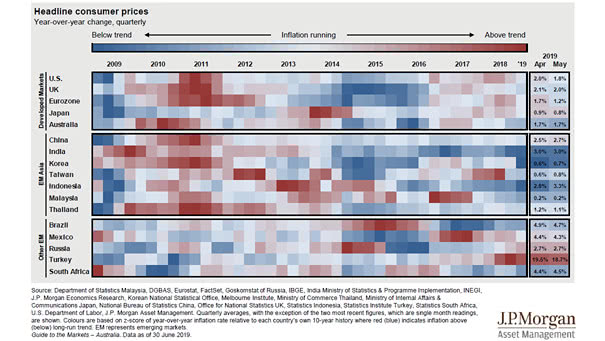
Global Inflation
Global Inflation Interesting chart showing that inflation is largely a global phenomenon. Picture Source: J.P. Morgan Asset Management
Global Inflation Interesting chart showing that inflation is largely a global phenomenon. Picture Source: J.P. Morgan Asset Management
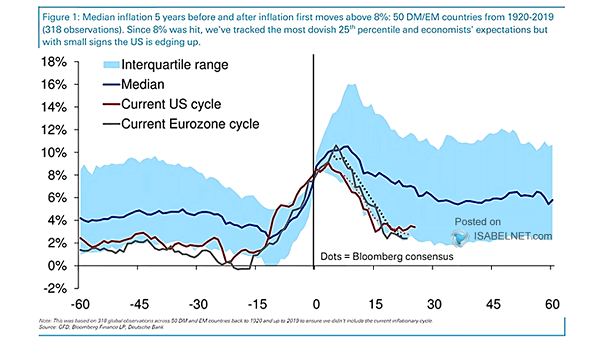
What Happens Globally When Inflation Hits 8% Historically, after a spike above 8%, global median inflation tends to be stickier over the following 5 years, causing economic challenges and impacting the purchasing power of individuals and businesses. Image: Deutsche Bank
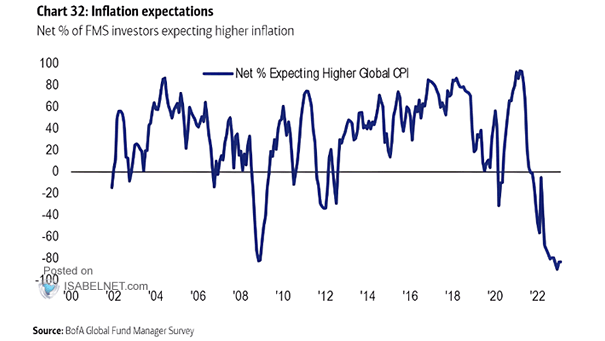
Inflation – Net % Expecting Higher Global CPI Almost all FMS investors expect inflation rates to fall. Image: BofA Global Fund Manager Survey
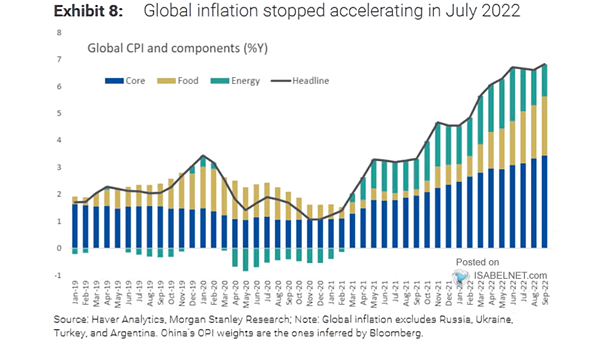
Inflation – Global CPI and Components Is global inflation close to peaking? Image: Morgan Stanley Research
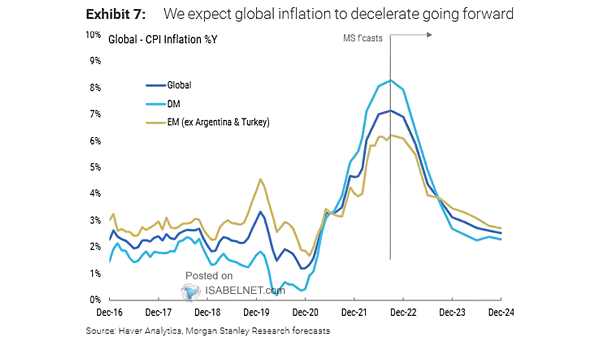
Global CPI Inflation Global inflation is expected to decline substantially in 2023. Image: Morgan Stanley Research
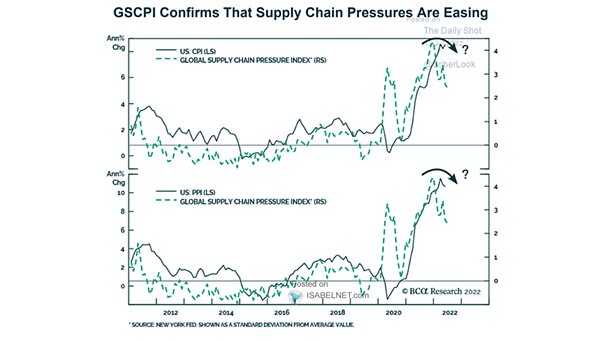
Inflation – U.S. CPI and PPI vs. Global Supply Chain Pressure Index Supply-chain pressures show signs of easing, which is good news for U.S. inflation. Image: BCA Research
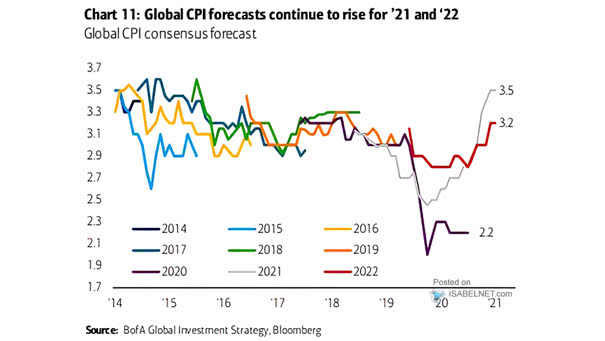
Inflation – Global CPI Consensus Forecast Will global CPI continue to rise in 2022? Image: BofA Global Investment Strategy
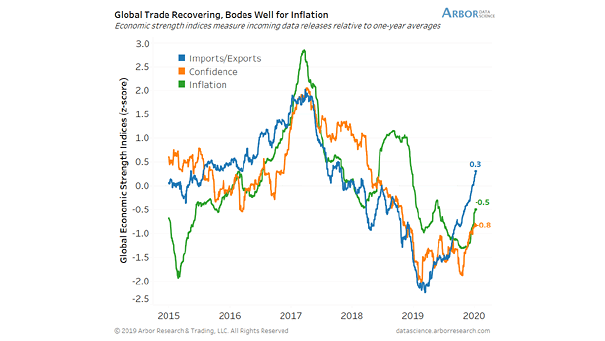
Global Economic Strength Indices (Imports/Exports, Confidence, Inflation) Global trade is recovering after a period of weakness. That’s good news for inflation. Image: Arbor Research & Trading LLC
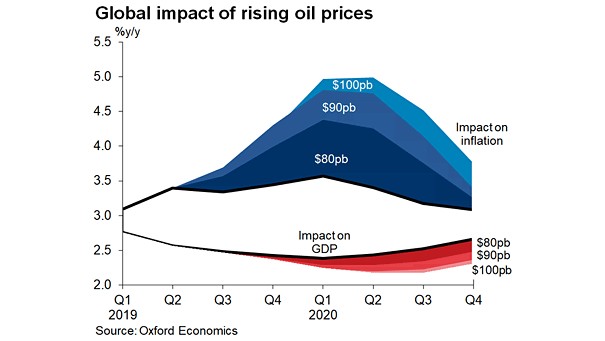
Global Impact of Rising Oil Prices on Global GDP and Inflation Nice chart showing the global impact of rising oil prices on GDP and inflation. Image: Oxford Economics
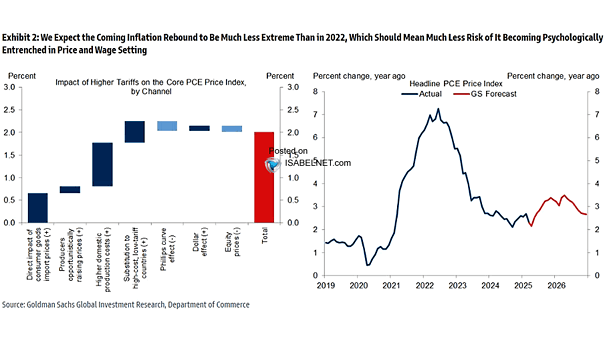
U.S. Core PCE Inflation Forecast Goldman Sachs sees U.S. core PCE cooling to 2.2% year-over-year by Q4 2027, and that makes a string of additional rate hikes beyond today’s pricing hard to justify. Image: Goldman Sachs Global Investment Research
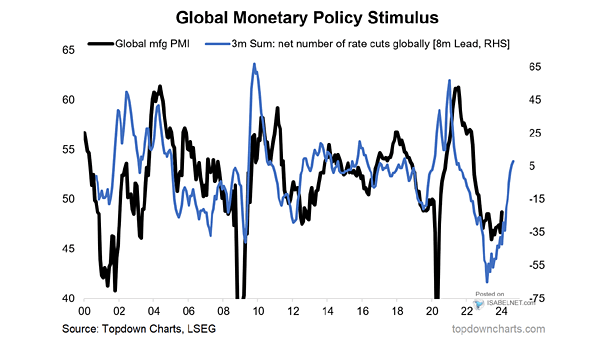
Global Monetary Policy Stimulus and Global Manufacturing PMI 2026 belonged to global growth, but the wind is turning. Inflation is firming, putting rate hikes back in play. The road into 2027 looks slower and bumpier. Image: Topdown Charts