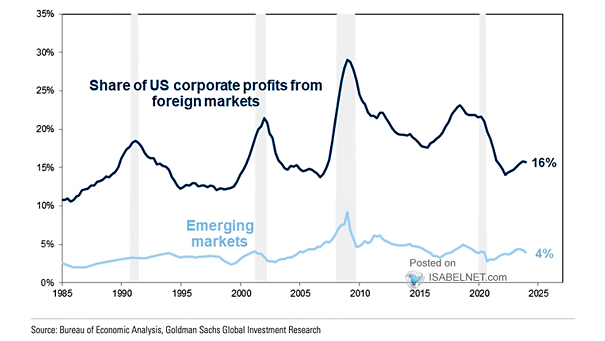
ISM Composite Index vs. Corporate Profits

ISM Composite Index vs. Corporate Profits The decline in the ISM Composite Index indicates a weakening of the U.S. economy, which could lead to lower corporate profits. Image: Merrill Lynch Wealth Management

Corporate Profits After Tax vs. S&P 500

Corporate Profits After Tax vs. S&P 500 The gap between the S&P 500 and corporate profits after tax remains wide. Has the S&P 500 more room to fall? Image: Real Investment Advice

After-Tax Corporate Profits as a Share of GDP

After-Tax Corporate Profits as a Share of GDP Profit margins have risen sharply to an all-time high in the third quarter of 2021. Image: Goldman Sachs Global Investment Research

S&P 500 EPS vs. U.S. NIPA Corporate Profits

S&P 500 EPS vs. U.S. NIPA Corporate Profits This chart puts into perspective the wide divergence between S&P 500 EPS and U.S. NIPA corporate profits. Image: BofA Research Investment Committee

S&P 500 Index vs. U.S. Corporate Profits After Tax Index

S&P 500 Index vs. U.S. Corporate Profits After Tax Index Do valuations still matter? This chart puts into perspective the wide divergence between the S&P 500 and U.S. corporate profits after tax. Image: Morgan Stanley Research