U.S. Stocks Relative to Bonds

U.S. Stocks Relative to Bonds U.S. stocks are at their strongest relative to bonds since Trump’s inauguration, supported by persistent risk appetite and the perception of U.S. market resilience amid global uncertainty. Image: Bloomberg

U.S. Households’ Allocation to Equity, Bond and Cash

U.S. Households’ Allocation to Equity, Bond and Cash Americans’ love for stocks has driven household equity allocations to historic highs, increasing wealth but also sparking concerns about market stability and the risks of shifting investor sentiment. Image: Goldman Sachs Global Investment Research

S&P 500 and Treasury Bond to Corporate BB High Yield Spread

S&P 500 and Treasury Bond to Corporate BB High Yield Spread Widening credit spreads often signal upcoming declines in the S&P 500, serving as a valuable leading indicator of equity market stress because they typically react early to shifts in market sentiment and risk. Image: Real Investment Advice

Weekly Bond Fund Flows

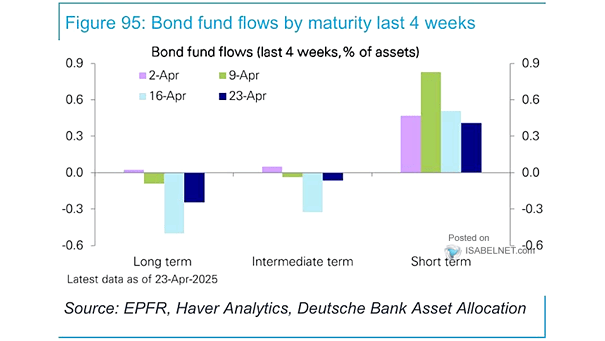
Weekly Bond Fund Flows Short-term bond funds are attracting substantial investor capital amid market volatility and economic uncertainty. Image: Deutsche Bank Asset Allocation

Bond Volatility – MOVE Index

Bond Volatility – MOVE Index The MOVE index, indicating the implied volatility of U.S. Treasury options, has recently reached its highest level since 2023, reflecting heightened uncertainty and broader financial instability. Image: The Daily Shot

U.S. High Yield Corporate Bond Spreads

U.S. High Yield Corporate Bond Spreads While tight high-yield credit spreads generally reflect robust market confidence, they can also serve as a warning of excessive investor complacency. Given this dual nature, it’s crucial to monitor credit spreads closely. Image: Topdown Charts

S&P 500 vs. High-Grade U.S. Bonds vs. Junk U.S. Bonds

S&P 500 vs. High-Grade U.S. Bonds vs. Junk U.S. Bonds While U.S. stocks generally have higher long-term returns, the current economic climate may favor junk U.S. bonds as a more stable investment option amidst fears of an equity downturn. Image: Bloomberg

Debt-to-GDP and 10-Year Government Bond Yield

Debt-to-GDP and 10-Year Government Bond Yield While it might seem intuitive that higher debt burdens would lead to higher yields due to increased risk, this relationship has not held true in practice. Yields are influenced by multiple economic factors, not just debt levels. Image: BCA Research

AAII – U.S. Retail Investors Allocation to Stocks, Bonds and Cash

AAII – U.S. Retail Investors Allocation to Stocks, Bonds and Cash High equity allocations and low cash positions don’t always mean a market reversal is near. However, they suggest that much of the market’s potential gains may already be priced in, as investors have heavily committed to equities. Image: Real Investment Advice

Bond Flows

Bond Flows The current interest rate environment has created an attractive landscape for bank loan funds, driving robust inflows. Image: Deutsche Bank Asset Allocation

China – Nominal GDP Growth vs. 10-Year Government Bond Yield

China – Nominal GDP Growth vs. 10-Year Government Bond Yield The persistent drop in bond yields is often seen as a sign of increasing investor caution regarding economic growth, which does not bode well for China’s nominal GDP growth moving forward. Image: Alpine Macro