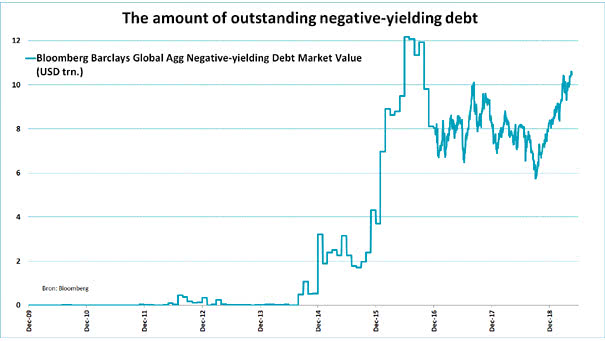
The Amount of Outstanding Negative-Yielding Debt since 2009
The Amount of Outstanding Negative-Yielding Debt since 2009 Investors are paying governments for the privilege of holding their bonds and are losing so much money in real terms. Raising interest rates in the future could be painful for bond investors. Image: Jeroen Blokland, Bloomberg