S&P 500 Revenues

S&P 500 Revenues The reported 4.8% real revenue growth for the S&P 500 excluding energy in Q2 2025 is a strong indicator of economic strength, marking the highest growth since early 2022. Image: Goldman Sachs Global Investment Research

S&P 500 Foreign Revenues by Sector

S&P 500 Foreign Revenues by Sector S&P 500 companies derive 28% of their total revenues from foreign markets — a figure that has remained relatively stable in recent years. The remaining 72% is generated domestically within the United States. Image: Goldman Sachs Global Investment Research

Foreign Revenues by Region for the S&P 500

Foreign Revenues of S&P 500 Companies While S&P 500 companies are broadly exposed to global markets, the majority of their sales—and thus, much of their operational and macroeconomic risk—remains tied to the U.S. economy. Image: Goldman Sachs Global Investment Research

Tariffs and U.S. Government Revenues

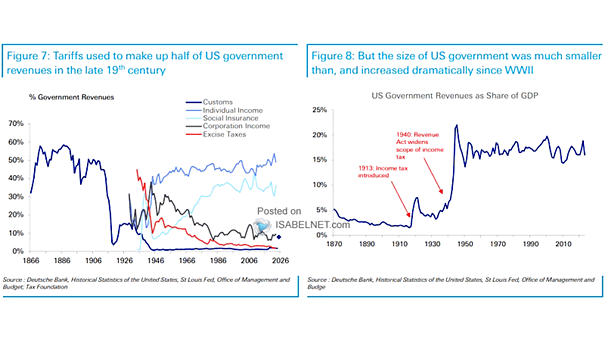
Tariffs and U.S. Government Revenues Tariffs played a crucial role in the early industrialization of the United States, but their effectiveness in today’s global economy are potentially detrimental as they act as an economic drag, hurting more industries than they help. Image: Deutsche Bank

Luxury Goods Coverage Constant Currency Revenue Growth

Luxury Goods Coverage Constant Currency Revenue Growth The luxury goods sector is expected to grow by 4% in 2024, suggesting a slight decline in the luxury goods market compared to the previous year. Image: BofA Global Research

U.S. Dollar Strength vs. Frequency of Reported Revenue Beats

U.S. Dollar Strength vs. Frequency of Reported Revenue Beats A weaker U.S. dollar is correlated with more revenue beats, reflecting the potential benefits of currency depreciation on corporate financial outcomes. Image: Goldman Sachs Global Investment Research

S&P 500 Revenues Minus S&P 500 Costs

S&P 500 Revenues Minus S&P 500 Costs Increased costs have outpaced S&P 500 revenue growth, which is not good news. Image: Morgan Stanley Wealth Management

S&P 500 Total Number of Employees to Total Revenues Ratio

S&P 500 Total Number of Employees to Total Revenues Ratio In 1986, it took 8 employees to generate US$1 million in revenue. Today, the S&P 500 is 70% less labor intensive than it was in the 80s. Image: BofA Global Research