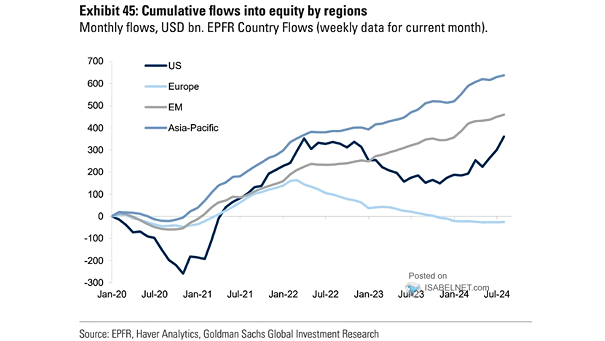
Global Equity Fund Flows Since 2019
Global Equity Fund Flows Since 2019 This chart puts into perspective inflows to global equity funds in November. Image: Goldman Sachs Global Investment Research
Global Stocks – Global Equity Flows Record 3-week inflows of $89 billion into global stocks. Image: BofA Global Investment Strategy
Global Equity Flows – Global Stocks Largest 2-week inflow into global equities ever, as vaccine optimism grows. Image: BofA Global Investment Strategy
Global Equity Market Sentiment Chart suggesting that global investors are still optimistic, as global stock market sentiment remains above its one-year rolling average. Image: Nomura
Global Equity Fund Flows and U.S. Elections Historically, global equity fund flows have improved after U.S. elections. Image: Goldman Sachs Global Investment Research
Japan and Global Equity Markets With a soft domestic economy, Japan’s equity market has lagged global equities. Image: Gavekal, Macrobond
Global Equity ETF Flows U.S. equity ETF flows remain strong amid the coronavirus turbulence. Image: J.P. Morgan
Global Equity Flows vs. Global Equities vs. Bonds Over the past 12 months, global equities suffer record outflows since the Global Financial Crisis. Image: BofA Global Investment Strategy
Cumulative Flow into Global Equity ETFs U.S. equity ETF flows have been strong amid the coronavirus turbulence. Image: J.P. Morgan
Is Tech in a Bubble? – Global Equity Market, Technology with Shiller PE This chart suggests that on every metric, global tech is much healthier than it was during the internet bubble. Image: Pictet Asset Management