S&P 500 Index vs. S&P 500 NTM EPS Divided by Moody’s BAA + Dividend Yield
S&P 500 Index vs. S&P 500 NTM EPS Divided by Moody’s BAA + Dividend Yield Is the S&P 500 at risk of a major correction? Image: Morgan Stanley Research
S&P 500 Index vs. S&P 500 NTM EPS Divided by Moody’s BAA + Dividend Yield Is the S&P 500 at risk of a major correction? Image: Morgan Stanley Research
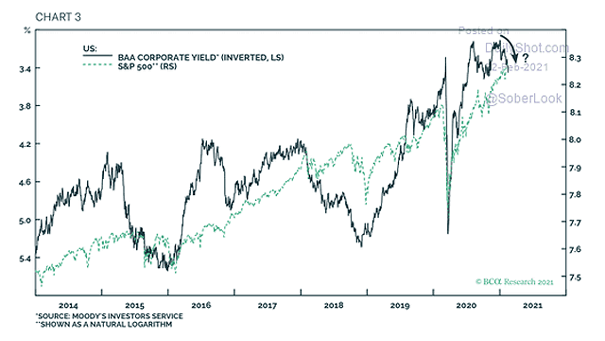
BAA Corporate Yield (Inverted) vs. S&P 500 Can stocks keep rising or should investors expect a market correction? Image: BCA Research

Yield Spread (Baa Bonds – Utility Dividends) Chart suggesting that utilities are cheap relative to Baa bonds. Image: Morgan Stanley
Yield Spread (Baa Bonds – Utility Dividends) This interesting chart suggests that utilities are currently cheap. Image: Morgan Stanley Research
U.S. Private Sector Yield Curve Currently, the U.S. private sector yield curve (20-year Baa bonds/bank prime rate) is the most inverted since October 2007. Image: GnS Economics