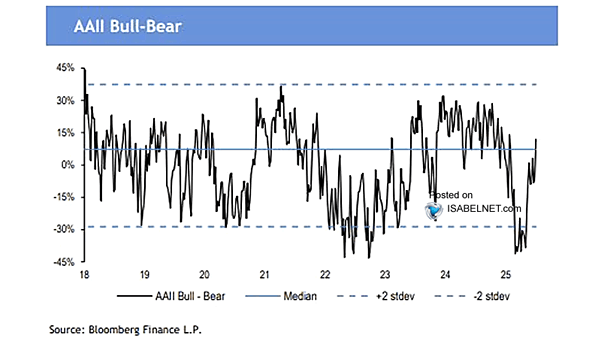
NAAIM Exposure Index – Investor Sentiment​

NAAIM Exposure Index – Investor Sentiment The National Association of Active Investment Managers Exposure Index represents the two-week moving average exposure to U.S. equity markets reported by NAAIM members. The NAAIM Exposure Index at 76.70 indicates that active investment managers have still a relatively high level of exposure to the market, and remain confident for the time…

Sentiment – Net Bullish Ratio vs. S&P 500 Index

Net Bullish Sentiment vs. S&P 500 Index Net bullish sentiment remains elevated. While the prevailing sentiment is positive, it is accompanied by warnings about the sustainability of such optimism and the need for careful risk management moving forward. Image: Real Investment Advice

Sentiment – 5-Day U.S. Put/Call Ratio Composite

Sentiment – 5-Day U.S. Put/Call Ratio Composite A rising 5-day put/call ratio may pose a risk to the U.S. equity market, as it shows an increasing preference for put options over call options, reflecting heightened bearish sentiment among traders. Image: BofA Global Research

Different Market Sentiment Indicators

Different Market Sentiment Indicators Most market sentiment indicators demonstrate a willingness to take on risk, signaling an optimistic market outlook. Image: Goldman Sachs Global Investment Research

Investor Sentiment – U.S. Market Greed/Fear Index

Investor Sentiment – U.S. Market Greed/Fear Index A Market Greed/Fear Index reading of 87.83 points to substantial market greed and high investor optimism, which can indicate an overheated market and potentially foreshadow a correction. Image: Real Investment Advice

Sentiment Indicator and Stock Positioning

Sentiment Indicator and Stock Positioning The GS sentiment indicator no longer being stretched is a positive sign. This indicates a balanced sentiment among investors and could result in more sustainable market trends and lower volatility. Image: Goldman Sachs Global Investment Research

Fear & Greed Index – Investor Sentiment

Fear & Greed Index – Investor Sentiment With a reading of 49, the Fear & Greed Index currently suggests a neutral level of market sentiment, indicating a balanced mix of fear and greed among investors. Image: Cable News Network

Sentiment – Risk Appetite and Expected U.S. Equity Market Performance

Sentiment – Risk Appetite and Expected U.S. Equity Market Performance U.S. equity investors’ risk appetite has declined in July, marking a shift towards net risk aversion not seen since January. Investors have also grown increasingly pessimistic about the prospects for near-term returns. Image: S&P Global Market Intelligence

AAII U.S. Investor Sentiment Bull – Bear Spread

AAII U.S. Investor Sentiment Bull – Bear Spread The AAII U.S. investor sentiment bull-bear spread shows signs of FOMO, reflecting increased optimism and concerns about market overheating. Image: The Daily Shot