S&P 500 Valuation Matrix (12-Month Forward EPS and P/E Multiple)
S&P 500 Valuation Matrix (12-Month Forward EPS and P/E Multiple) Does the S&P 500 still have upside potential? Image: BofA Global Investment Strategy
Valuation – S&P 500 Next-Twelve-Months P/E Multiple Is the S&P 500 still too expensive? Image: Goldman Sachs Global Investment Research
U.S. Labor Market – Multiple Jobholders, Primary and Secondary Jobs Full Time More Americans are taking on second jobs as the cost of living increases. Image: The Daily Shot
S&P 500 Index Performance During Periods of Multiples Fed Rate Hikes Historically, Fed rate hikes cycles are not a threat to the S&P 500 Index. Image: LPL Research
S&P 500 Valuation Multiples
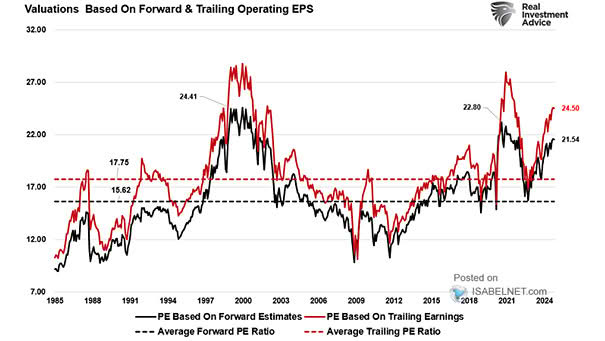
 S&P 500 valuation multiples remain stretched and well above averages. Image: Goldman Sachs Global Investment Research
Valuation – S&P 500 Forward P/E Multiple and First Hike of Fed Tightening Cycle Historically, the S&P 500 forward P/E remains flat in the 6 months before and after the start of the first Fed hike. Image: Goldman Sachs Global Investment Research
FY2 P/E Multiple of S&P 500 Top and Bottom Sector-Neutral Valuation Quintiles The valuation dispersion for stocks in the S&P 500 is historically high. Image: Goldman Sachs Global Investment Research
Valuation – Consensus FY2 P/E Multiple – Information Technology vs. S&P 500 S&P 500 valuations remain high, particularly info tech stocks. Image: Goldman Sachs Global Investment Research
Valuation – S&P 500 FY2 P/E Multiple – Five Largest Stocks vs. Other 495 Stocks S&P 500 valuations remain high, particularly FAAMG stocks. Image: Goldman Sachs Global Investment Research
FY2 P/E Multiple of S&P 500 Top and Bottom Valuation Quintiles The valuation gap between high and low valuation stocks has become the widest since 2000. Image: Goldman Sachs Global Investment Research