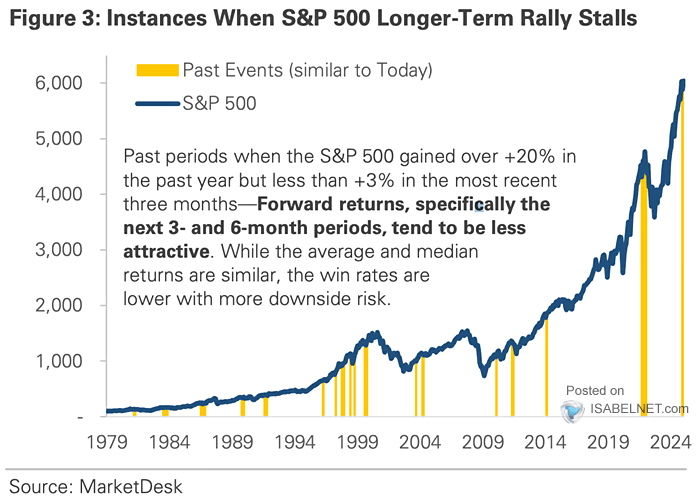
Instances When S&P 500 Longer-Term Rally Stalls

Instances When S&P 500 Longer-Term Rally Stalls Historically, periods of strong annual stock gains of over 20% followed by short-term flat performance have often led to weaker returns in the following 3 to 6 months. Image: MarketDesk Research

S&P 500 Annual Performance Based How the Santa Claus Rally Does

S&P 500 Annual Performance Based How the Santa Claus Rally Does The Santa Claus rally historically indicates positive market momentum during the holiday season, which may extend into the following year and lead to further gains, signaling optimism for the entire year. Image: Carson Investment Research

S&P 500 Returns during the Santa Claus Rally

S&P 500 Returns during the Santa Claus Rally Bulls celebrate the Santa Claus Rally, which typically sees U.S. stock prices rise during the last five trading days of December and the first two trading days of January. Since 1950, this rally has averaged a gain of 1.3%. Image: Carson Investment Research

The Santa Claus Rally – S&P 500 Index Returns

The Santa Claus Rally – S&P 500 Index Returns Historically, a bullish Santa Claus rally has tended to lead to strength for January and the full year, often leaving investors as giddy as a kid on Christmas Day! Image: Carson Investment Research

S&P 500 Index Returns and Santa Claus Rally

S&P 500 Index Returns and Santa Claus Rally Historically, a bearish Santa Claus rally does not tend to bode well for January and the full year. Image: LPL Research