This great long-term forecast model displays the annual and total return expected for the next 10 years with a high degree of confidence
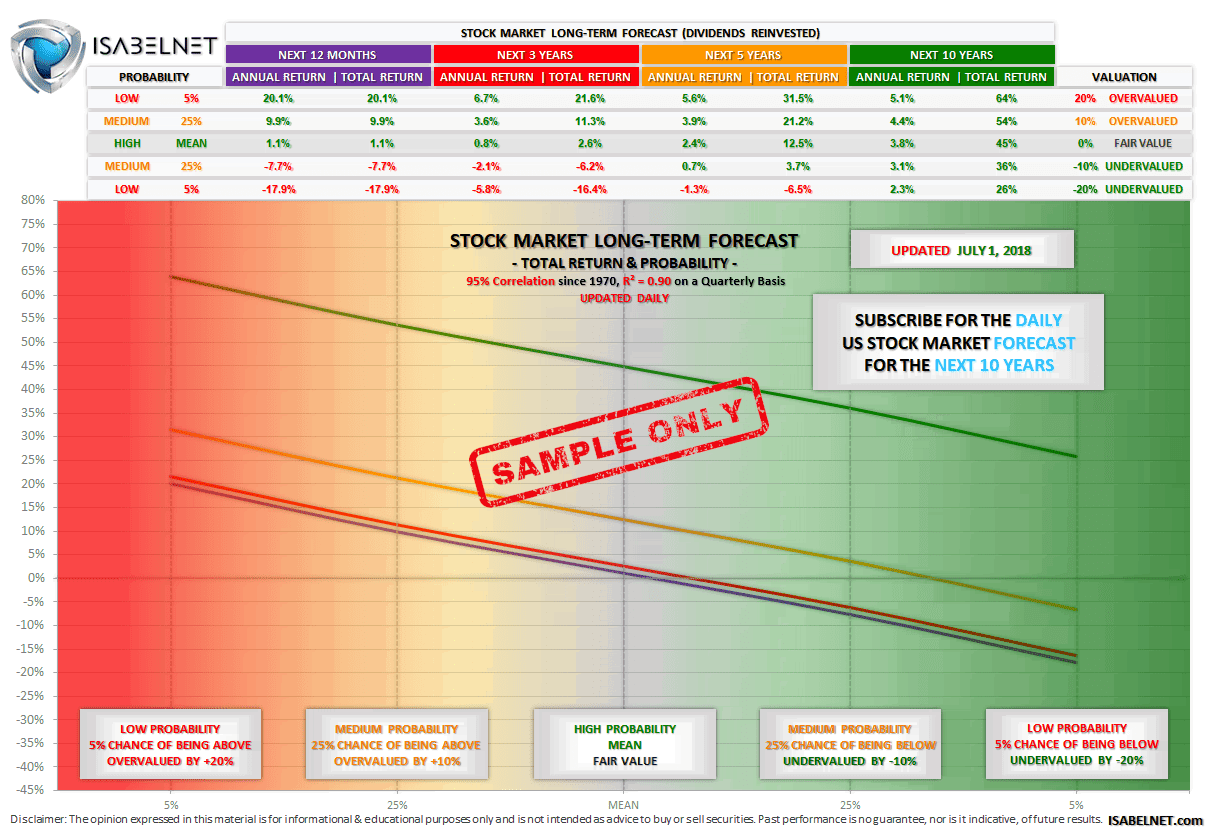
This advanced model makes a forecast for the next 12 months, next 3 years, next 5 years, and next 10 years, with dividends reinvested.
For each period, it displays the annual and total return.
It shows what the probability of each event happening is. Probability is a way to show how often an event will happen.
And it shows what the valuation of each event is.
Here is an example on July 1, 2018:
The annual return expected for the next 10 years will be 3.8%, corresponding to a 45% total return. This is a high probability. If the total return corresponds to 45% in 10 years, then the US stock market will be at fair value.
If the total return corresponds to 54% in 10 years, then the US stock market will be overvalued by 10%. There is a 25% chance on a quarterly basis that the US stock market total return will be above 54%. This is a medium probability.
If the total return corresponds to 26% in 10 years, then the US stock market will be undervalued by -20%. There is a 5% chance on a quarterly basis that the US stock market total return will be below 26%. This is a low probability.
Here is another example using the graph.
The total return expected for the next 5 years will be 12.5%. This is a high probability. If the total return corresponds to 12.5% in 5 years, then the US stock market will be at fair value.
If the total return corresponds to 31.5% in 5 years, then the US stock market will be overvalued by 20%. There is a 5% chance on a quarterly basis that the US stock market total return will be above 31.5%. This is a low probability.
If the total return corresponds to 3.7% in 5 years, then the US stock market will be undervalued by -10%. There is a 25% chance on a quarterly basis that the US stock market total return will be below 3.7%. This is a medium probability.
This powerful long-term forecast model is updated daily. It has a great 96% correlation with the US stock market on a quarterly basis since 1970 and an R² of 0.92. It means that 92 percent of the US stock market variance is predictable by the flows of data used.
By using this formidable decision support tool, you will empower yourself to make much better investment decisions.