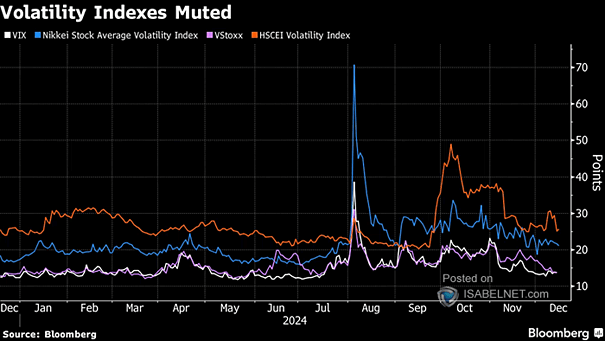
VIX – Volatility Indexes
S&P 500 and VIX Although U.S. stocks are rallying and volatility remains low—reflecting market confidence—significant underlying threats from rising trade frictions and policy uncertainty persist. Image: Bloomberg
S&P 500 and VIX Although U.S. stocks are rallying and volatility remains low—reflecting market confidence—significant underlying threats from rising trade frictions and policy uncertainty persist. Image: Bloomberg
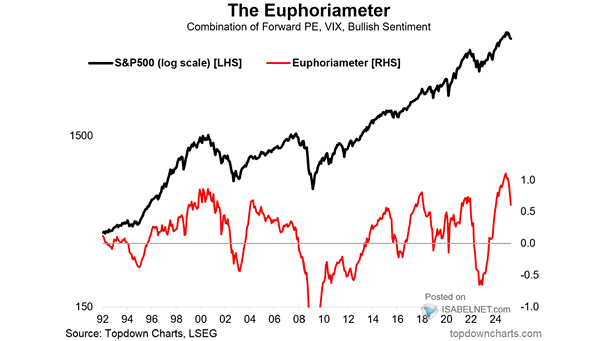
S&P 500 and Combination of Forward PE, VIX, Bullish Sentiment The Euphoriameter, which combines forward P/E, VIX, and bullish sentiment, remains elevated and suggests caution based on cycles analysis. Image: Topdown Charts

Sentiment/VIX Composite vs. S&P 500 Current low levels of the Sentiment/VIX Composite Index tend to coincide with market lows, indicating potential buying opportunities rather than the onset of larger market reversions. Image: Real Investment Advice
VIX Buy Signals After VIX surges, the S&P 500 rose in 85% of instances over the next few months—but not during recessions. Image: J.P. Morgan
S&P 500 and VIX Above 50 The VIX rose above 60 during the 2008 financial crisis and the 2020 COVID-19 crash. In both cases, the stock market had already bottomed before the VIX dropped below 31. This pattern seems to be repeating in 2025. Image: Fundstrat Global Advisors, LLC
S&P 500 After VIX Spikes >50 (Intraday), First Instance in a Month An intraday VIX spike to 50, often triggered by panic-driven market declines, typically signals a recovery ahead. Historically, the S&P 500 has gained an average of 20% in the year following such events. Image: Carson Investment Research
U.S. High Yield Credit Spreads vs. VIX High-yield credit spreads have widened by over 150bps from their 17-year lows, signaling growing financial stress. While rising credit spreads have often been a precursor to recessions, they can sometimes lead to false signals. Image: Topdown Charts
VIX Futures Curve Market participants are anticipating a potential decline in volatility, reflecting hopes for reduced uncertainty and stabilization of trade-related concerns impacting markets. Image: The Daily Shot
Volatility – Return vs. VIX While a higher VIX indicates increased market uncertainty, it can also present opportunities for investors to achieve better average returns by strategically navigating the volatility. Image: Alpine Macro
VIX – Volatility Index While the current low VIX suggests investors are feeling as calm as a cat in a sunbeam, it also serves as a warning about potential future volatility if market conditions shift unexpectedly. Image: Morgan Stanley Wealth Management
VIX Indexed to Election Day Equity implied volatility typically increases leading up to U.S. presidential elections and decreases afterward, mirroring the market’s reaction to political uncertainty and its resolution. Image: Goldman Sachs Global Investment Research