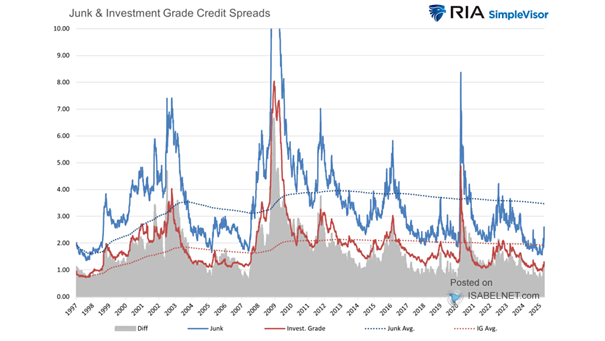
Junk and Investment Grade Credit Spreads
Junk and Investment Grade Credit Spreads Corporate bond yield spreads are often used as a gauge of financial market stress. They can provide insights into the likelihood of an economic downturn, but they are not foolproof predictors. Image: Real Investment Advice