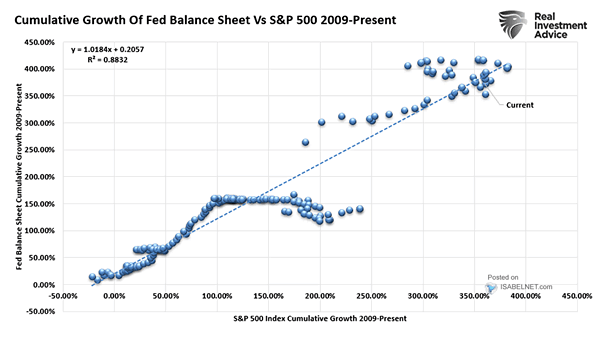
96% Correlation with the US Stock Market and an R² of 0.92 since 1970

96% Correlation with the US Stock Market and an R² of 0.92 since 1970 Our forecasting models have a fantastic 96% correlation with the US stock market on a quarterly basis since 1970 and an R² of 0.92. It means that 92 percent of the US stock market variance is predictable by the flows of data…
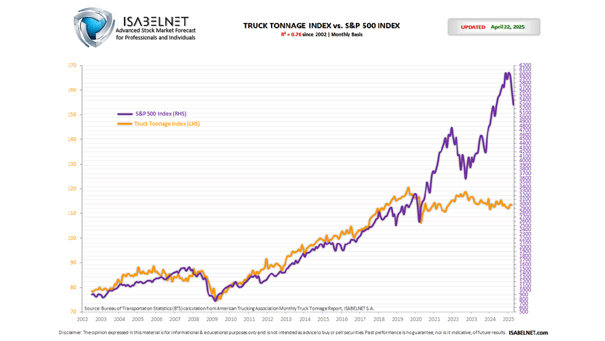
Truck Tonnage vs. S&P 500 Index

Truck Tonnage vs. S&P 500 Index The Truck Tonnage Index increased 1.2% in October. Trucks represent 72.6% of U.S. freight and serve as a barometer of the U.S. economy. This chart shows that the U.S. stock market tends to increase in line with the physical size and expansion of the U.S. economy (R² = 0.79…

Inflation vs. S&P 500 Trailing P/E

Inflation vs. S&P 500 Trailing P/E The U.S. equity market tends to see multiple compression when inflation rises (R² = 0.54). Image: BofA US Equity & Quant Strategy

U.S. Macro Fundamentals vs. S&P 500

U.S. Macro Fundamentals vs. S&P 500 This chart shows the current wide divergence between U.S. lead indicators and the S&P 500 (R² = 0.97). Image: Pictet Asset Management

S&P 500 Valuation – Consensus FY2 P/B and Return on Equity (ROE)

S&P 500 Valuation – Consensus FY2 PB and Return on Equity (ROE) This chart suggests that the current valuation of the S&P 500 appears broadly consistent with the correlation between consensus FY2 P/B and return on equity (R² = 0.42). Image: Goldman Sachs Global Investment Research