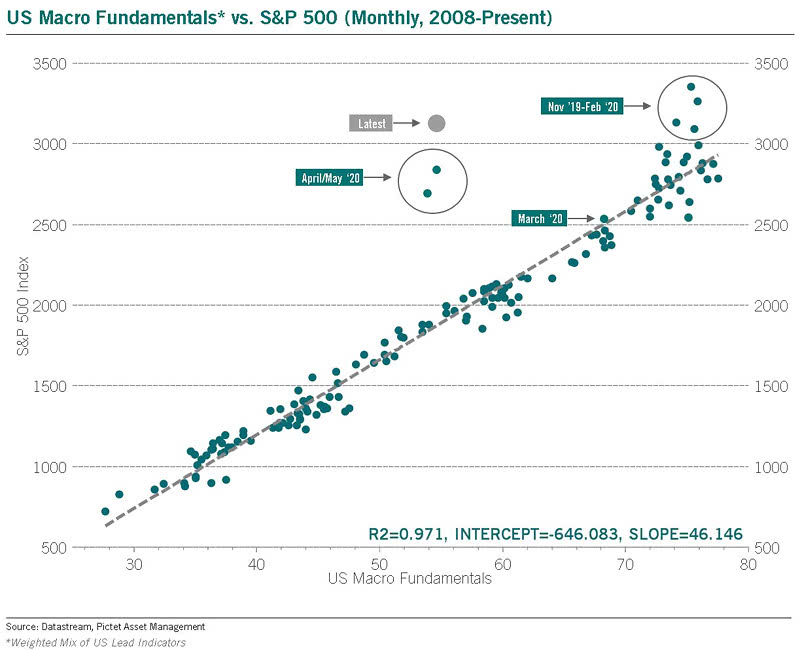
Jun 19 2020 Off U.S. Macro Fundamentals vs. S&P 500 This chart shows the current wide divergence between U.S. lead indicators and the S&P 500 (R² = 0.97).Image: Pictet Asset Management