U.S. Stock Market Bull and Bear Indicator - S&P 500
Thursday, our Stock Market Bull & Bear Indicator was bullish well before the opening bell and the S&P 500 didn’t disappoint, ending the day up 0.81%.
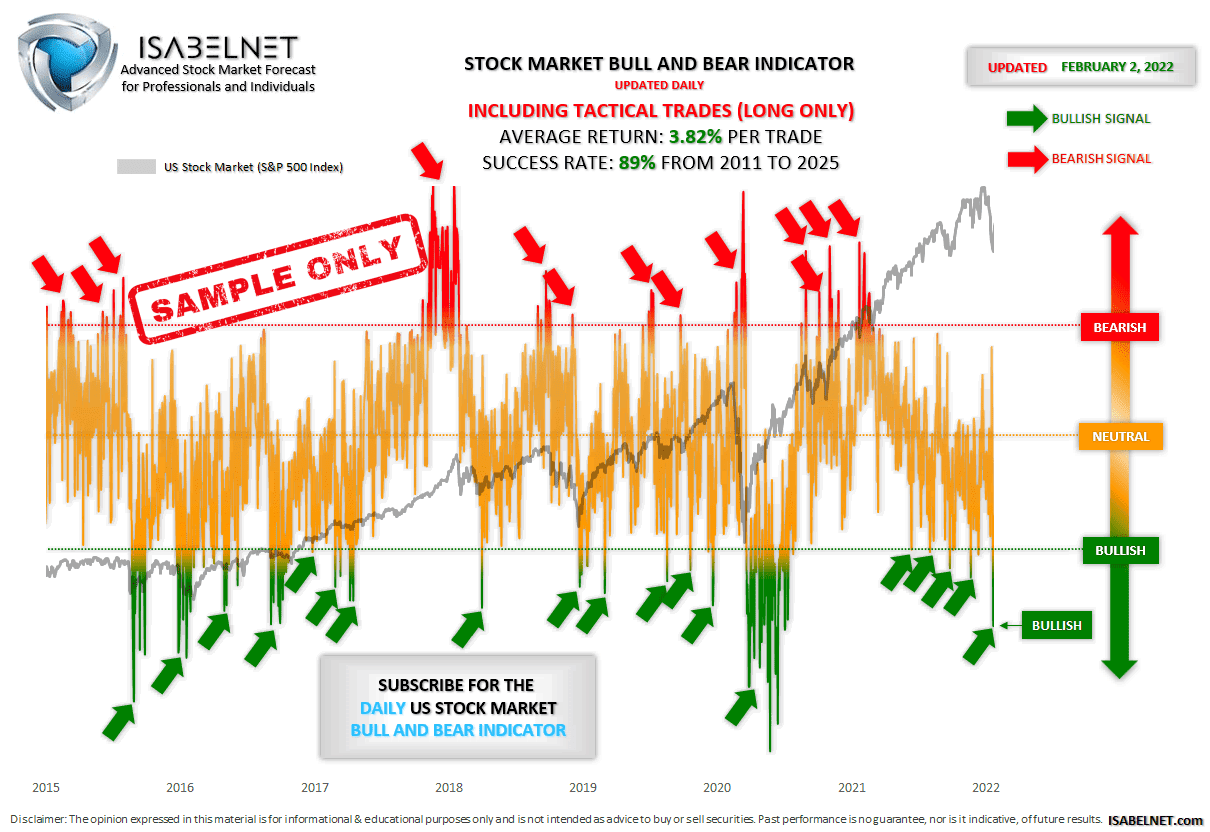
Using multiple financial data, this great model helps investors navigate through different market conditions. It suggests whether the U.S. stock market tendency is bullish, bearish or neutral. It is a contrarian indicator.
A bullish signal suggests that the U.S. stock market may go up, while a bearish signal suggests that the U.S. stock market may go down.
By being aware of market trends, investors can take advantage of both bullish and bearish tendencies within the U.S. stock market. This fabulous stock market bull and bear indicator is updated daily, including the latest 12 months period, and tactical trades (long only) with an average return per trade of 3.88% and a success rate of 90% from 2011 to 2026.
By using this formidable decision support tool, you will empower yourself to make much better investment decisions. Please consider subscribing to the PRO membership.