Global Manufacturing PMI
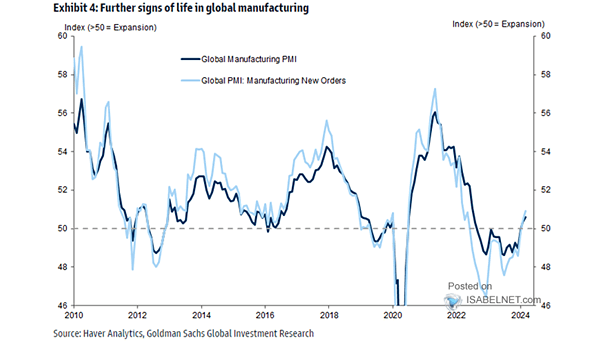
Global Manufacturing PMI Leading indicators and supportive fiscal policies suggest potential upside risks to global manufacturing PMI in the near term. Image: Deutsche Bank
Global Manufacturing PMI Leading indicators and supportive fiscal policies suggest potential upside risks to global manufacturing PMI in the near term. Image: Deutsche Bank
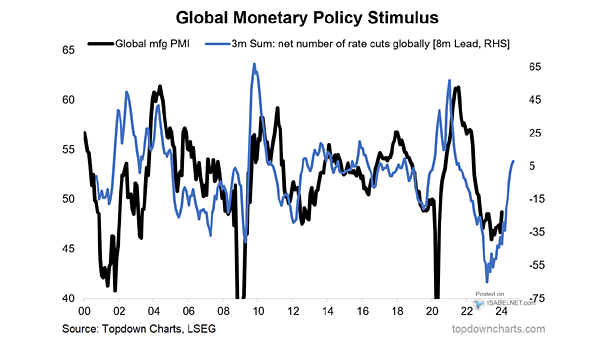
Central Banks – Global Monetary Policy Stimulus Leads Global Manufacturing PMI As global monetary policy stimulus tends to lead global manufacturing PMI by 8 months, could this signal the end of the economic slowdown? Image: Topdown Charts

Global Manufacturing PMI and Global Consumer Discretionary vs. Staples The global consumer discretionary vs. staples relative performance suggests that the global manufacturing PMI could be trending towards expansion, which is good news. Image: Topdown Charts
Percent of Central Banks Tightening vs. Global Manufacturing PMI Global policy tightening is putting downward pressure on global growth. Image: BofA Global Research
Earnings – Global Manufacturing PMI New Orders vs. World Trailing 12-Month EPS (Leading Indicator) Global manufacturing PMI new orders tend to lead world EPS growth by 12 months. Image: BofA Global Research
U.S. 10-Year Treasury Yield and Global Manufacturing PMI (Leading Indicator) Should investors prepare for a substantial decline in the global economy? Image: TS Lombard
G3 Credit Impulse and Global Manufacturing PMI (Leading Indicator) G3 credit impulse tends to lead global manufacturing PMI by 12 months. Image: Nordea and Macrobond
China Credit Impulse Leads Global Manufacturing PMI China credit impulse tends to lead global manufacturing PMI by 12 months. Credit impulse is the change in new credit issued as a percentage of GDP. Image: Nordea and Macrobond
Global Manufacturing PMI Despite a slight decline, global manufacturing activity remains expansionary. Image: J.P. Morgan Asset Management
Global Manufacturing PMI vs. MSCI ACWI PMI’s are peaking. Historically, markets tend to lead the macro for most time periods. Image: BofA Global Investment Strategy
Global Manufacturing PMI in October Global manufacturing PMIs continue to be strong in March. Image: Morgan Stanley Research