S&P 500 Buybacks vs. CEO Confidence (Leading Indicator)
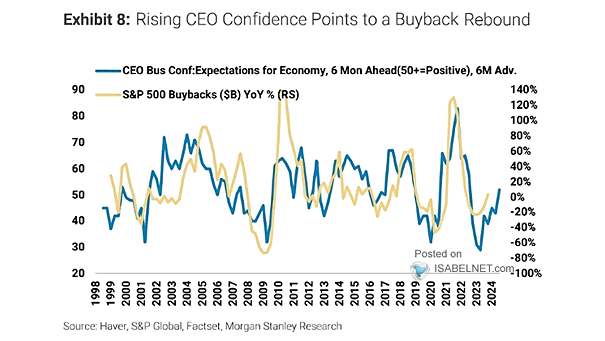
S&P 500 Buybacks vs. CEO Confidence (Leading Indicator) S&P 500 buybacks are likely to rebound, as CEO confidence typically leads buybacks by 6 months. Image: Morgan Stanley Research
S&P 500 Buybacks vs. CEO Confidence (Leading Indicator) S&P 500 buybacks are likely to rebound, as CEO confidence typically leads buybacks by 6 months. Image: Morgan Stanley Research
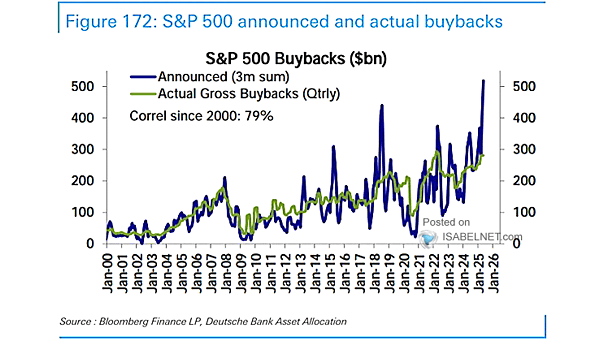
S&P 500 Buybacks Investors generally consider the persistent robustness of S&P 500 buybacks as a positive sign, as they have the potential to create sustainable value for shareholders. Image: Deutsche Bank Asset Allocation

S&P 500 Buyback Index vs. S&P 500 Could buybacks support U.S. stocks in the near-term? Image: Topdown Charts
S&P 500 Buyback Index Stock buybacks continue to increase which is good news for U.S. stocks. Image: TS Lombard
S&P 500 Buyback Index vs. S&P 500 Index 2021 is expected to be a good year for buybacks and dividends. Image: Morgan Stanley Wealth Management
IPO and Secondary Offerings Net S&P 500 Buybacks This is the first time since 2009 that equity issuance is higher than S&P 500 buybacks. Image: BofA Global Investment Strategy
S&P 500 Buybacks Relative to Index Market Capitalization A recovery in corporate earnings could lead to a rebound in buybacks this year. Image: Gavekal, Macrobond
Cumulative S&P 500 Buybacks 2009-2019 Are buybacks driving the show? Thanks to tax cuts and low interest rates, corporate stock buybacks are booming. Over the past decade, S&P 500 companies bought back $5 trillion shares, while cumulative flows from households and foreigners are only a drop in the bucket. But what would happend if companies reinvested instead…
S&P 500 Buyback Index vs. S&P 500 Total Return Index This chart clearly shows the large divergence between the S&P 500 Buyback Index and the S&P 500 Total Return Index. Image: Real Investment Advice
S&P 500 Buybacks Index The S&P 500 Buyback Index is down on a YoY basis. As a reminder, buybacks are the source of the rally in the stock market since 2009. Image: Crescat Capital LLC