New S&P 500 Index All-Time Highs Per Year
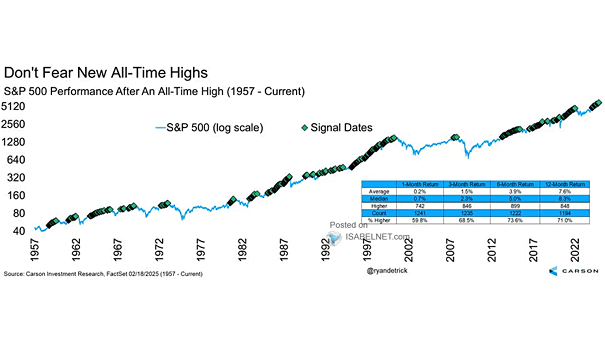
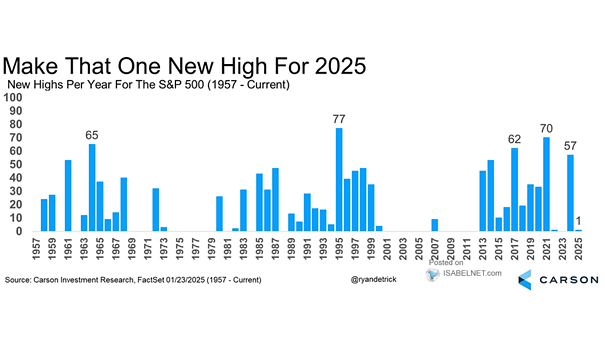
New S&P 500 Index All-Time Highs Per Year The S&P 500 notched its ninth record high of 2025 yesterday, marking its 1,250th all-time high since 1957—a milestone that reflects the index’s steady long-term growth! Image: Carson Investment Research