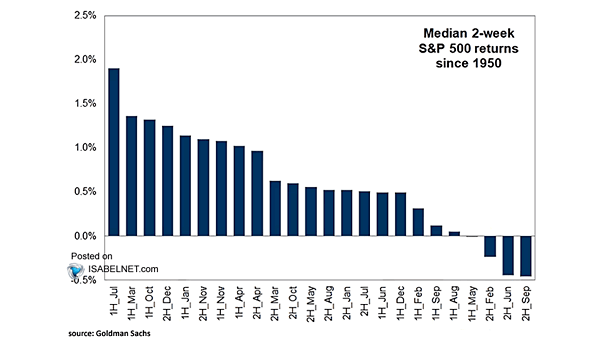
Median 2-Week S&P 500 Returns
Median 2-Week S&P 500 Returns Since 1950, the first half of July has consistently been a seasonally strong period for the S&P 500, making it the best half-month of the year. Image: Goldman Sachs Global Investment Research