Valuation – S&P 500 Real Value Index

Valuation – S&P 500 Real Value Index Since 1871, the S&P 500 real total returns, dividends reinvested, have averaged 6.9% a year. The U.S. Real Value Index has always mean-reverted — and right now, it is between 10% and 20% above fair value. Image: TS Lombard

Valuations – Market Values as a Proportion of World GDP

Valuations – Market Values as a Proportion of World GDP Global equities have tripled their weight since the 1990s, jumping from 75% to above 200% of world GDP—an expansion that screams just how far valuations have run. Honestly, what could go wrong? Image: Goldman Sachs Global Investment Research

Largest Company in Terms of Market Value in the S&P 500 in Each Year Since 1955

Largest Company in Terms of Market Value in the S&P 500 in Each Year Since 1955 The market’s biggest players usually cluster in the sector riding the economic zeitgeist—and right now, that’s tech. It’s where innovation happens, growth speeds up, and investors chase the next breakout story. Image: Goldman Sachs Global Investment Research

Announced Buyback Value

Announced Share Buybacks in the U.S. The ongoing pipeline of stock repurchase programs demonstrates strong confidence among executives and continues to underpin the U.S. stock market through 2025 and beyond. Image: Bloomberg

Performance – Value vs. Growth

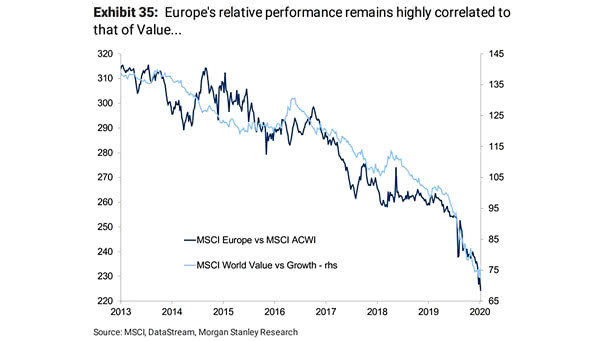
Performance – Value vs. Growth The U.S. market is experiencing outperformance in growth sectors driven by innovation and strong earnings, whereas value sectors dominate outside the U.S. due to slower earnings growth and differing economic dynamics. Image: Goldman Sachs Global Investment Research

10-Year U.S. Treasury Yield Fair Value

10-Year U.S. Treasury Yield Fair Value The fair value model for the 10-year U.S. Treasury yield, based on market variables, suggests a fair value close to 3.9%. Image: Deutsche Bank

After-Tax Nonfinancial Corporate Profits as Share of Gross Value Added

After-Tax Nonfinancial Corporate Profits as Share of Gross Value Added While U.S. corporate profits fell in Q1 2025 due to higher costs and economic uncertainty, they remain historically high, reflecting both the strength and the vulnerability of large companies in the current economic climate. Image: Bloomberg

DXY U.S. Dollar Index vs. Nasdaq Composite / MSCI World Value

DXY U.S. Dollar Index vs. Nasdaq Composite / MSCI World Value Over the past two years, U.S. growth stocks—known for their sensitivity to currency fluctuations—have exhibited a strong correlation with the U.S. dollar. Image: Gavekal, Macrobond