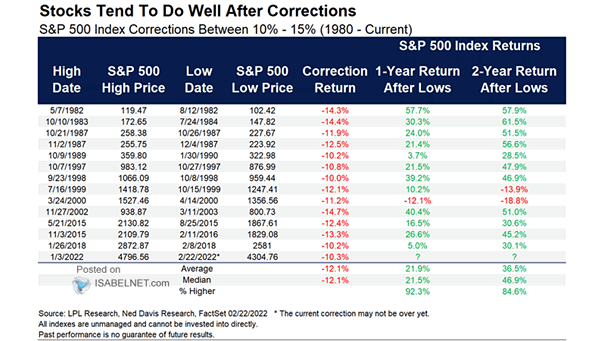
S&P 500 Return After Corrections
S&P 500 Return After Corrections Historically, once corrections end, the S&P 500 tends to be positive over 12 and 24 months. Image: LPL Financial LLC Click the Image to Enlarge
S&P 500 Corrections Recent market corrections bottomed out in the last week of the quarter. Image: Gavekal, Macrobond
Corrections and Bear Markets – Secular Bull Markets vs. Secular Bear Markets This chart highlights the corrections & bear markets during secular bear markets and secular bull markets. The difference is significant. Image: Fidelity Investments
MSCI World Median Correction and Recovery vs. Current Drawdown This charts shows a “beautiful V” and puts the current drawdown into perspective. Image: Ken Fisher, Fisher Investments
S&P 500 Index Corrections Since 1980, the S&P 500 index tends to do well one year and two years after lows. Image: LPL Financial LLC
S&P 500 Bear Market Correction Potential This chart suggests a level of 1800 for the S&P 500 index, assuming 18x trailing earnings and $100/share due to the recession. Image: Real Investment Advice
S&P 500 from Record Peaks to a Correction This chart puts the coronavirus crash into perspective. Image: Yahoo Finance
S&P 500 and Secular Bull Market Corrections Chart suggesting that the 100-week MA and the 200-week MA are key secular market supports. Image: BofA Global Research
U.S. Market Corrections since World War II Since World War II, the 26 corrections have an average decline of 13.7% over four months, and have taken four months to recover. Image: CNBC
S&P 500 Drawdowns – Average Corrections since WW2 The recent correction has been sharper than the average since WW2, with the S&P 500 going to correction territory in a few days. Image: Goldman Sachs Global Investment Research