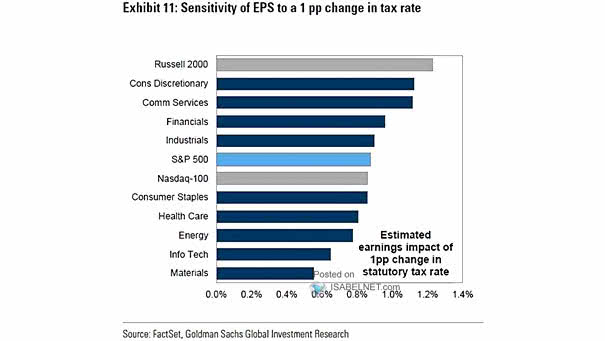
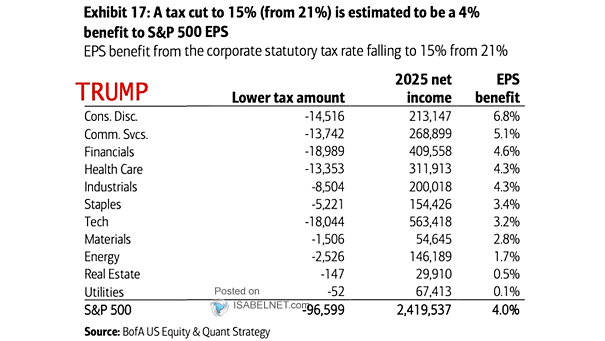
Corporate Profits After Tax vs. S&P 500
Corporate Profits After Tax vs. S&P 500 The gap between the S&P 500 and corporate profits after tax remains wide. Has the S&P 500 more room to fall? Image: Real Investment Advice
U.S. ISM Manufacturing PMI vs. Growth Tax (Leading Indicator) Should investors expect a sharp contraction of the U.S. economy? Image: Alpine Macro
S&P 500 Return Seasonality and Tax Day Historically, U.S. stocks tend to rally in the two-week period after tax day. Image: J.P. Morgan
U.S. ISM Manufacturing PMI vs. Growth Tax (Inverted) vs. ISM New Orders Minus Inventories (Leading Indicator) Should investors expect a sharp fall in the U.S. ISM Manufacturing PMI? Image: Alpine Macro
After-Tax Corporate Profits as a Share of GDP Profit margins have risen sharply to an all-time high in the third quarter of 2021. Image: Goldman Sachs Global Investment Research
Prediction Market Odds of U.S. Corporate Tax Rate in 2022 Is a corporate tax hike unlikely? Image: Goldman Sachs Global Investment Research
U.S. Corporate Tax Increase as a Percent of GDP Have markets priced in Biden’s corporate tax hikes? Image: Morgan Stanley Wealth Management
Distribution of S&P 500 Sector Consensus 2022 Effective Tax Rates Investors should not fear a global minimum corporate tax rate of 15%. Image: Goldman Sachs Global Investment Research
Estimated Impact on Consensus 2022 EPS of Global 15% Minimum Tax Rate Wall Street should not fear a global minimum corporate tax rate of 15%. Image: Goldman Sachs Global Investment Research
Estimated S&P 500 2022 Earnings Impact Based on 25% Tax Rate Have markets priced in Biden’s tax hikes? Image: BofA US Equity & Quant Strategy