Average Probability S&P 500 Volatility Regime

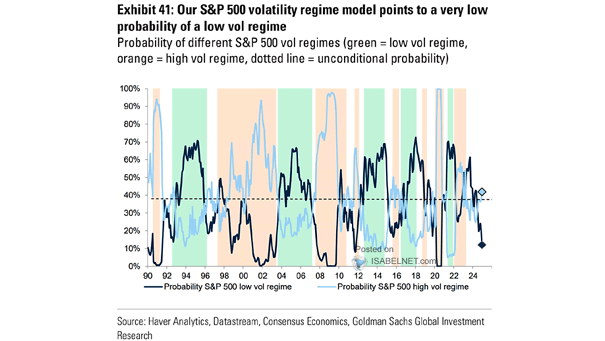
Average Probability S&P 500 Volatility Regime The probability of a high S&P 500 volatility regime has increased, suggesting that elevated volatility could persist throughout 2025. Image: Goldman Sachs Global Investment Research
S&P 500 Volatility

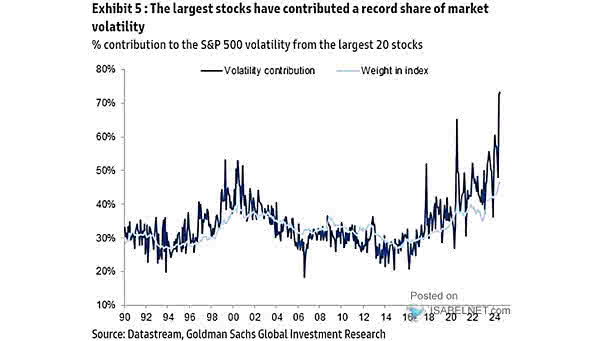
S&P 500 Volatility The concentration of large-cap stocks has significantly impacted market volatility, with these stocks accounting for a record share of it. Image: Goldman Sachs Global Investment Research

S&P 500 Volatility History

S&P 500 Volatility History The stock market crash of 1929, the Black Monday of 1987, the global financial crisis in 2008, and the COVID-19 crisis were the most extreme events. Image: Goldman Sachs Global Investment Research

S&P 500 Volatility by Decade

S&P 500 Volatility by Decade Volatility ended this decade at a lower level than the previous decade. Image: Reuters

S&P 500 Volatility in 2020

S&P 500 Volatility in 2020 Goldman Sachs economic model suggests volatility of 14.7 on average next year. Image: Goldman Sachs Global Investment Research

U.S. Nominal GDP vs. S&P 500 Volatility

U.S. Nominal GDP vs. S&P 500 Volatility This chart shows that the S&P 500 volatility remains high in a context of slower macroeconomic cycles. Image: Goldman Sachs Global Investment Research

SPDR S&P 500 ETF Trust Three-Month 90/110 Implied Volatility

SPDR S&P 500 ETF Trust Three-Month 90/110 Implied Volatility Signs of stability are emerging in the S&P 500 Index after the sharp correction, as traders abandon bets on further significant declines, reflecting growing confidence in the market. Image: Bloomberg

VIX Index and S&P 500 Realized Volatility

VIX Index and S&P 500 Realized Volatility The spread between the VIX and the S&P 10-day realized volatility, when in the 98th percentile, may signal a potential opportunity for U.S. stocks to rally towards the end of the year. Image: BofA Global Research