Private Equity ETF
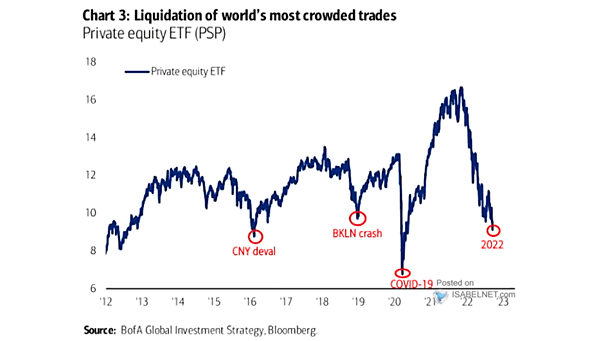
Private Equity ETF Private equity, after soaring, is returning back to earth. Image: BofA Global Investment Strategy
Private Equity ETF Private equity, after soaring, is returning back to earth. Image: BofA Global Investment Strategy
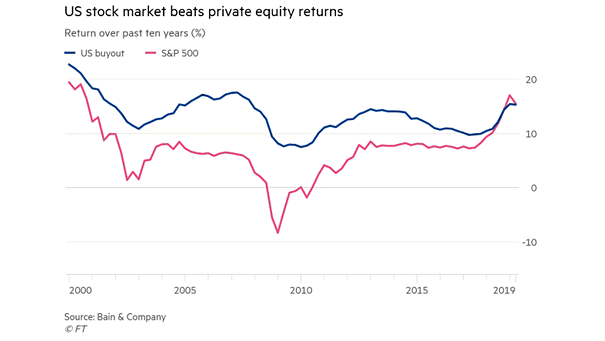
S&P 500 vs. U.S. Private Equity Returns The S&P 500 beats U.S. private equity’s returns for the first time. Image: Financial Times

North America Private Equity Assets Private equity keeps on growing and now represents an important part of the economy. Image: Financial Times
Russell 2000 Trailing EV/EBITDA Multiples vs. Private Equity EBITDA Multiples This chart shows that private equity multiples are currently higher than public equity multiples. Image: Strategas
Private-Equity Stock Performance vs. S&P 500 Thanks to low interest rates, private equity returns are rising. Image: The Wall Street Journal
GWIM Equity Allocation as % Assets Under Management BofA’s private clients show optimism about equity market growth and potential returns, as evidenced by their 63% portfolio allocation to equities. Image: BofA Global Investment Strategy
GWIM Equity Flows BofA’s private clients have been sellers of stocks this year. Image: BofA
GWIM Equity Flows – Buy the Dip? Time to buy the dip? BofA private clients have bought the dip in the past two weeks. Image: BofA Global Investment Strategy
S&P 500 and Gold – GWIM Equity Flows and Gold ETF Demand for gold remains strong. BofA private clients have been selling S&P 500 at 3000 and buying gold. Image: BofA Global Investment Strategy
Equity Returns Over the Past Decade Goldman Sachs Private Wealth Management is advising its wealthy clients to get back into equities and favor U.S. stocks (for informational purpose only, not a recommendation). Image: Bloomberg
Monthly Number of U.S. IPOs and S&P 500 The chart shows the fall in new listings, while private equity is booming. Image: Topdown Charts