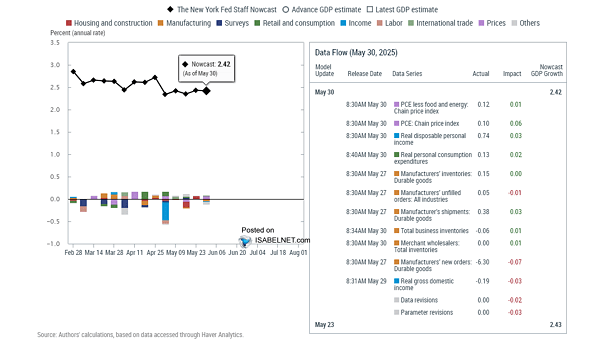
New York Fed GDP Nowcast
New York Fed GDP Nowcast The New York Fed raised its Q4 2026 U.S. GDP nowcast to 2.94% from 2.90%, pointing to an expansion that’s still holding its pace. Image: Federal Reserve Bank of New YorkClick the Image to Enlarge
New York Fed GDP Nowcast The New York Fed raised its Q4 2026 U.S. GDP nowcast to 2.94% from 2.90%, pointing to an expansion that’s still holding its pace. Image: Federal Reserve Bank of New YorkClick the Image to Enlarge
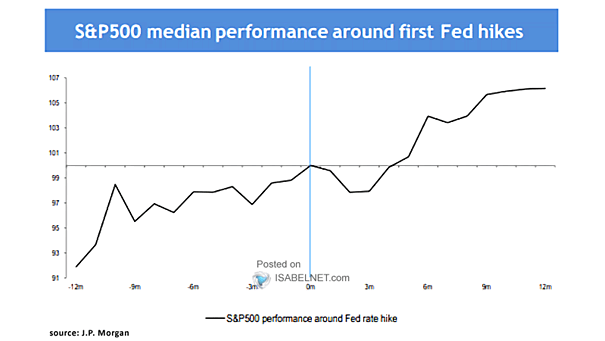
S&P 500 Median Performance Around First Fed Rate Hikes U.S. stocks often struggle for about four months after the first rate hike, then rebound. 2026 appears to be following the same pattern. Image: Goldman Sachs Global Investment Research
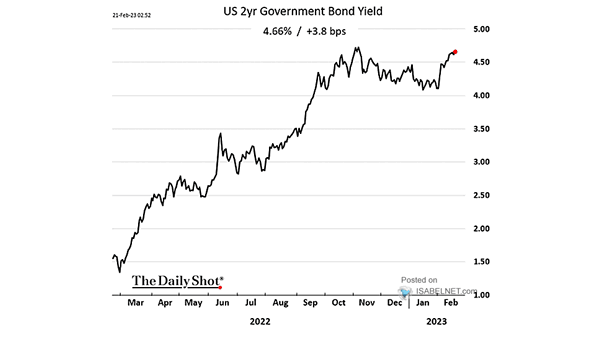
U.S. 2-Year Yield Around First Fed Rate Hikes U.S. yields often rise ahead of the first rate hike. In modest tightening cycles, they tend to peak soon after. In more sustained ones, they keep climbing. Image: Goldman Sachs Global Investment Research
Real World Tokenized Assets Tokenized real-world assets are finally gaining traction, but their share of the more than $100 trillion U.S. investable asset universe remains negligible. Adoption is only just getting started. Image: Deutsche Bank
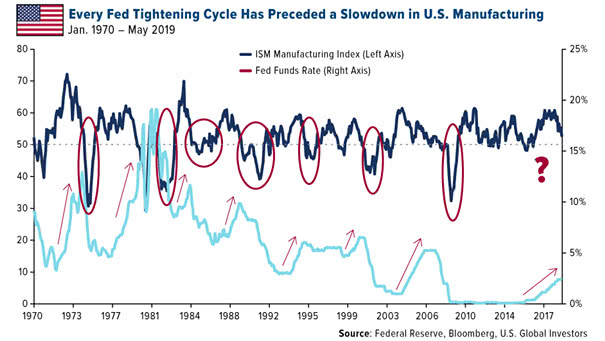
Number of Rate Hikes per Fed Tightening Cycle, 1994 to 2023 Since 1994, the Fed has gone through six tightening cycles. Five lasted for years and involved at least six rate hikes. But with real rates already starting from historically high levels, this cycle may be much shorter. Image: Real Investment Advice
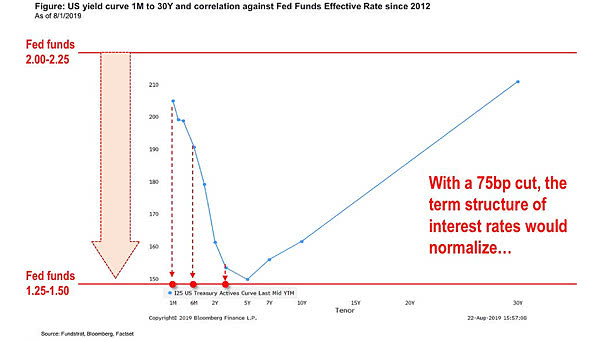
Fed Funds Rate Path Implied by the Median Dots The Fed is signaling higher rates for longer, with a two-hike baseline for 2026, a 2029 median fed-funds rate of 3.5% to 3.75%, and a neutral rate of 3.25%. Long-duration assets and leveraged trades are now facing a tougher road. Image: Goldman Sachs Global Investment Research
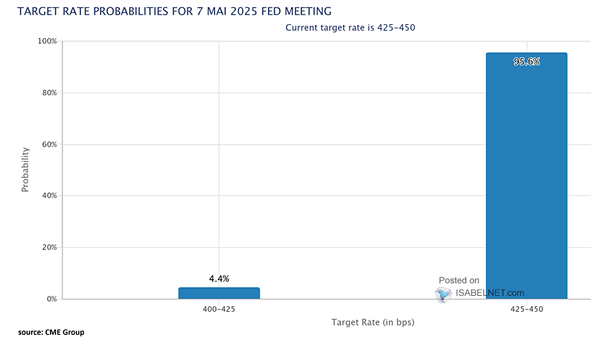
Fed Funds Rate – Target Probabilities at the Fed’s FOMC Meeting Traders are betting on a Fed rate hike today, with markets pricing in a 92.5% chance of a 25 bps move. But when oil drives inflation, rate hikes barely move the dial. Image: CME Group
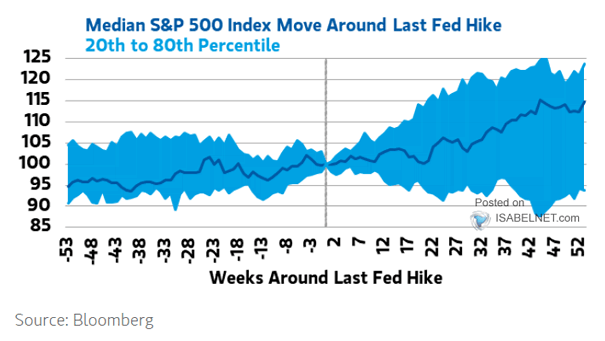
S&P 500 Return Around Start of Fed Hiking Cycles History says the S&P 500 tends to stumble in the weeks after the Fed starts hiking, before recovering as the broader trend resumes. Image: Goldman Sachs Global Investment Research
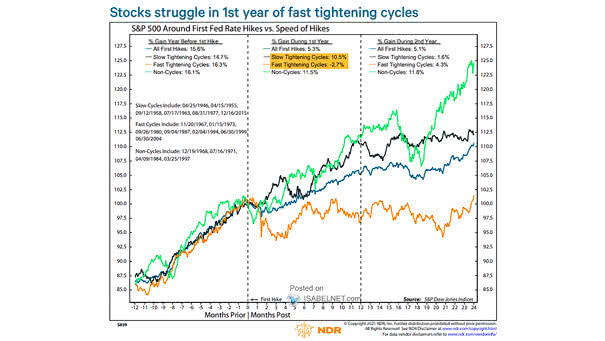
S&P 500 Around First Fed Rate Hikes vs. Speed of Hikes In fast tightening cycles, the S&P 500 typically struggles in the 12 months post-first hike; in slow or no cycles, it tends to rally. Near term, stocks stay shaky until investors believe in a “slow-hike” or “one-and-done” Fed. Image: Ned Davis Research
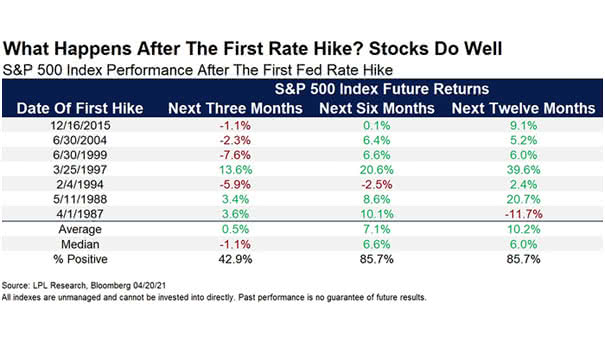
S&P 500 Index Performance After The First Fed Rate Hike Historically, the S&P 500 has weathered the Fed’s first rate hike better than investors might expect. Following an initial 25 bp move, the index often stumbles early but, in every cycle since 1990, has been higher a year later. Image: Carson Investment Research
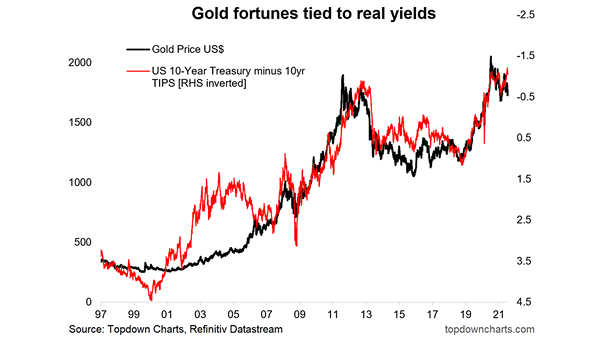
Gold Price vs. Market Pricing of 25bp Fed Hikes (Inverted) Gold struggles as energy‑driven inflation keeps Fed rate‑hike risks alive, lifting the dollar and real yields and capping near‑term gains for bullion. Image: Goldman Sachs Global Investment Research