Commodity Spot Index
Commodity Spot Index Are commodities poised for a new bull market as a reflation play? Image: Bloomberg
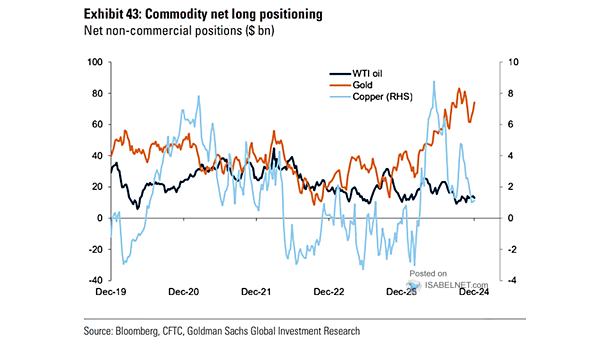
Commodities (Oil, Gold, Copper) – Commodity Net Long Positioning Net speculative copper positioning remains very bullish. Image: Goldman Sachs Global Investment Research
S&P 500 vs. Commodity Research Bureau Index Commodities relative to stocks remain cheap, but is it time to buy? Image: Fidelity Investments
Valuation – Commodity Prices Relative to S&P 500 Chart suggesting that commodity prices have never been more depressed relative to stocks, since the late 90’s. Image: U.S. Global Investors
Valuation – Commodity Prices Relative to Equities Chart suggesting that commodity prices have never been more depressed relative to equities, since the late 90’s. Image: Macrobond
World GDP and Real Commodity Price Returns Interesting chart showing the correlation between world GDP and real commodity price returns. Image: Oxford Economics, Macrobond
Commodity Stock Index vs. Dow Jones Industrial Average since 1937 The chart shows that commodity stock prices have never been more depressed relative to the stock market. This Commodity Stock Index aligns with S&P North American Natural Resource Stock Index. Image: Goehring & Rozencwajg
Brent Crude Oil Prices – Forecast vs. Forwards BofA expects brent crude oil prices to average $50/bbl in 2021, reflecting a recovery in global mobility and better growth. Image: BofA Global Commodity Research
Gold Prices vs. Commodities The declining correlation between the price of gold and commodities may suggest that the commodity bear super-cycle is nearing its end. Image: Wells Fargo Investment Institute
Seasonal Effects in the S&P 500 This interesting chart shows the seasonality of the S&P 500. This year, the S&P 500 is well above its historical average. Image: Commodity Seasonality